Read: Transform Linear Functions
Learning Objectives
- Define and use a vertical stretch or compression to graph a linear function
- Define and use a vertical shift to graph a linear function
- Combine transformations to graph a linear function
Graphing a Linear Function Using Transformations
Another option for graphing is to use transformations of the identity function [latex]f\left(x\right)=x[/latex] . A function may be transformed by a shift up, down, left, or right. A function may also be transformed using a reflection, stretch, or compression.Vertical Stretch or Compression
In the equation [latex]f\left(x\right)=mx[/latex], the m is acting as the vertical stretch or compression of the identity function. When m is negative, there is also a vertical reflection of the graph. Notice in the figure below that multiplying the equation of [latex]f\left(x\right)=x[/latex] by m stretches the graph of f by a factor of m units if [latex]m>1[/latex] and compresses the graph of f by a factor of m units if [latex]0<m<1[/latex]. This means the larger the absolute value of m, the steeper the slope.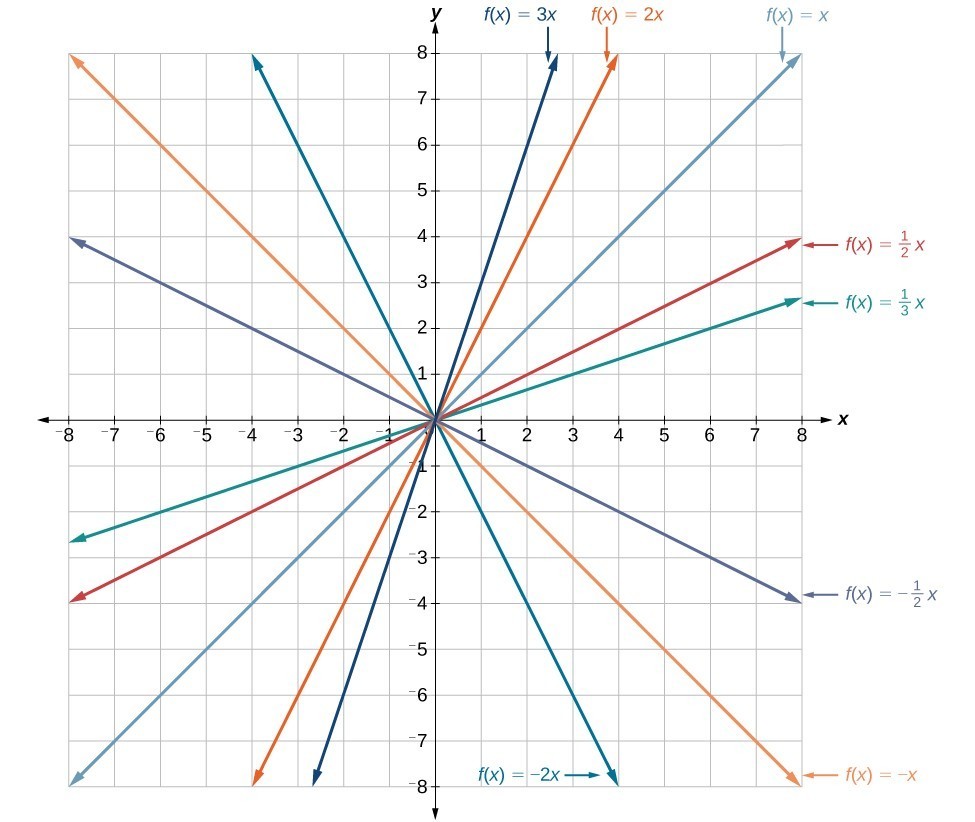 Vertical stretches and compressions and reflections on the function [latex]f\left(x\right)=x[/latex].
Vertical Shift
In [latex]f\left(x\right)=mx+b[/latex], the b acts as the vertical shift, moving the graph up and down without affecting the slope of the line. Notice in the figure below that adding a value of b to the equation of [latex]f\left(x\right)=x[/latex] shifts the graph of f a total of b units up if b is positive and [latex]|b|[/latex] units down if b is negative.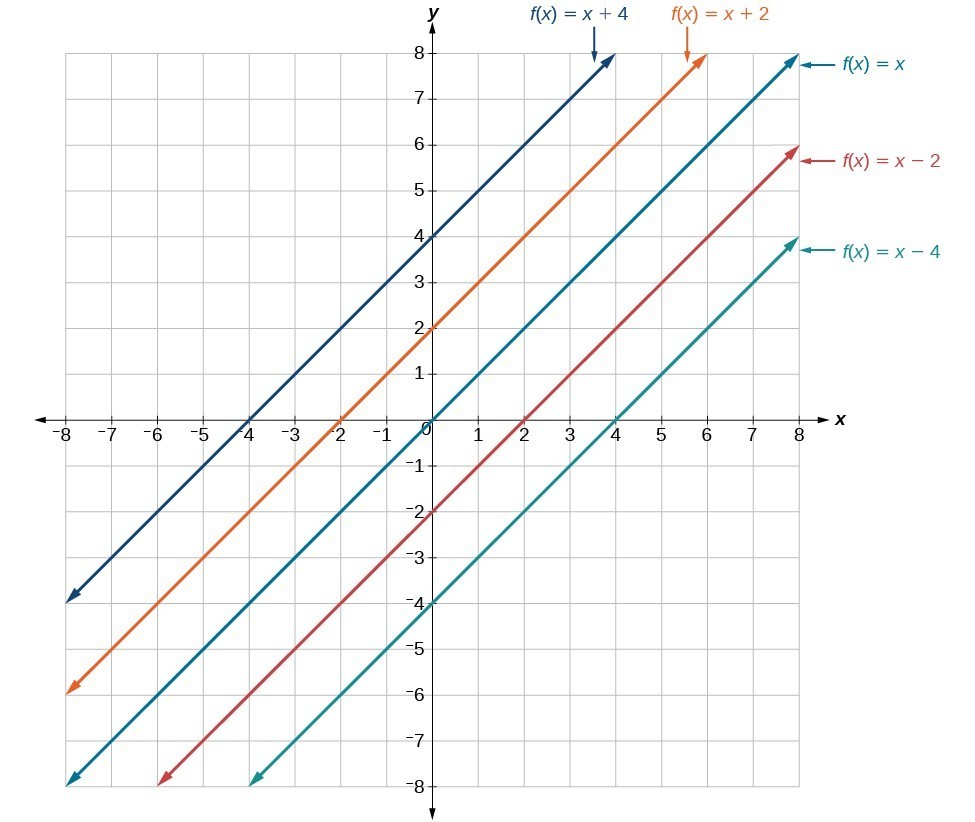 This graph illustrates vertical shifts of the function [latex]f\left(x\right)=x[/latex].
Using vertical stretches or compressions along with vertical shifts is another way to look at identifying different types of linear functions. Although this may not be the easiest way to graph this type of function, it is still important to practice each method.
This graph illustrates vertical shifts of the function [latex]f\left(x\right)=x[/latex].
Using vertical stretches or compressions along with vertical shifts is another way to look at identifying different types of linear functions. Although this may not be the easiest way to graph this type of function, it is still important to practice each method.
How To: Given the equation of a linear function, use transformations to graph the linear function in the form [latex]f\left(x\right)=mx+b[/latex].
- Graph [latex]f\left(x\right)=x[/latex].
- Vertically stretch or compress the graph by a factor |m|.
- Shift the graph up or down b units.
Example
Describe the transformations to the identity for the function [latex]f(x)=\dfrac{2}{3}x[/latex], and draw a graph.Answer:
In this case, [latex]m=\dfrac{2}{3}[/latex], so this is a vertical compression since [latex]0<m<1[/latex].
The graph of [latex]f(x)=\dfrac{2}{3}x[/latex] is plotted below with the identity:
 Note how the identity is compressed because the rate of change is "slowed" by the vertical compression of [latex]\dfrac{2}{3}[/latex]
Example
Describe the transformations to the identity for the function [latex]f(x)=2x[/latex], and draw a graph.Answer: In this case, [latex]m=2[/latex], so this is a vertical stretch since [latex]m>1[/latex]. The graph of [latex]f(x)=2x[/latex] is plotted below with the identity:
 y=2x and y=x
Example
Describe the transformations to the identity for the function [latex]f(x)=-2x[/latex], and draw a graph.Answer: In this case, [latex]m=-2[/latex], so this is a vertical stretch since [latex]|m|>1[/latex], the negative sign reflects the graph across the y axis. The graph of [latex]f(x)=-2x[/latex] is plotted below with the identity:
 y = x and y = -2x
Example
Graph [latex]f\left(x\right)=\dfrac{1}{2}x - 3[/latex] using transformations.Answer:
The equation for the function shows that [latex]m=\dfrac{1}{2}[/latex] so the identity function is vertically compressed by [latex]\dfrac{1}{2}[/latex]. The equation for the function also shows that [latex]b=–3[/latex] so the identity function is vertically shifted down [latex]3[/latex] units. First, graph the identity function, and show the vertical compression.
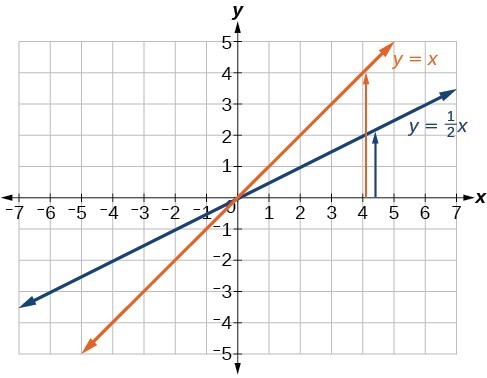 The function [latex]y=x[/latex], compressed by a factor of [latex]\dfrac{1}{2}[/latex].
Then show the vertical shift.
The function [latex]y=x[/latex], compressed by a factor of [latex]\dfrac{1}{2}[/latex].
Then show the vertical shift.
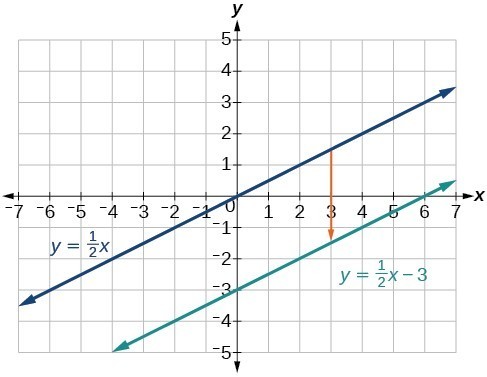 The function [latex]y=\dfrac{1}{2}x[/latex], shifted down [latex]3[/latex] units.
Q& A
In the example above, could we have sketched the graph by reversing the order of the transformations? No. The order of the transformations follows the order of operations. When the function is evaluated at a given input, the corresponding output is calculated by following the order of operations. This is why we performed the compression first.Summary
- Vertical compressions of the identity happen when the slope is between [latex]0[/latex] and [latex]1[/latex]
- Vertical stretches of the identity happen when the slope is greater than [latex]1[/latex]
- Reflections happen when the slope is negative
- Vertical shifts happen when the intercept is not equal to [latex]0[/latex]
- Transformations can be combined
Licenses & Attributions
CC licensed content, Original
- Graph a Linear Function as a Transformation of f(x)=x. Authored by: James Sousa (Mathispower4u.com) for Lumen Learning. License: CC BY: Attribution.
- Revision and Adaptation. Provided by: Lumen Learning License: CC BY: Attribution.
CC licensed content, Specific attribution
- Precalculus. Provided by: OpenStax Authored by: Jay Abramson, et al.. Located at: https://openstax.org/books/precalculus/pages/1-introduction-to-functions. License: CC BY: Attribution. License terms: Download For Free at : http://cnx.org/contents/[email protected]..
