Read: Applications of Systems of Linear Inequalities
Learning Objectives
- Write and graph a system that models the quantity that must be sold to achieve a given amount of sales
- Write a system of inequalities that represents the profit region for a business
- Interpret the solutions to a system of cost/ revenue inequalities
Example
Cathy is selling ice cream cones at a school fundraiser. She is selling two sizes: small (which has [latex]1[/latex] scoop) and large (which has [latex]2[/latex] scoops). She knows that she can get a maximum of [latex]70[/latex] scoops of ice cream out of her supply. She charges [latex]$3[/latex] for a small cone and [latex]$5[/latex] for a large cone. Cathy wants to earn at least [latex]$120[/latex] to give back to the school. Write and graph a system of inequalities that models this situation.Answer: First, identify the variables. There are two variables: the number of small cones and the number of large cones.
s = small cone
l = large cone
Write the first equation: the maximum number of scoops she can give out. The scoops she has available [latex](70)[/latex] must be greater than or equal to the number of scoops for the small cones (s) and the large cones [latex](2[/latex]l) she sells.
[latex]s+2l\le70[/latex]
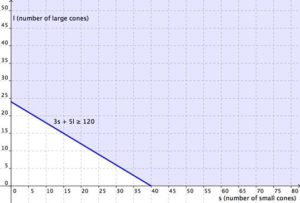
Write the second equation: the amount of money she raises. She wants the total amount of money earned from small cones [latex](3<i>s</i>)[/latex] and large cones [latex](5<i>l</i>)[/latex] to be at least [latex]$120[/latex].
[latex]3s+5l\ge120[/latex]
Write the system.
[latex]\begin{cases}s+2l\le70\\3s+5l\ge120\\s>=0\\l>=0\end{cases}[/latex]
Now graph the system. The variables x and y have been replaced by s and l; graph s along the x-axis, and l along the y-axis. First graph the region [latex]<i>s</i> + 2<i>l</i> ≤ 70[/latex]. Graph the boundary line and then test individual points to see which region to shade. We only shade the regions that also satisfy [latex]x>=0, y>=0[/latex]. The graph is shown below.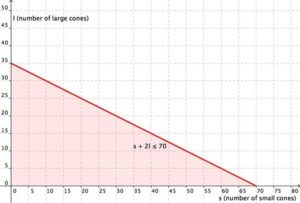 Now graph the region [latex]3s+5l\ge120[/latex] Graph the boundary line and then test individual points to see which region to shade. The graph is shown below.
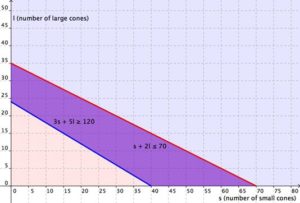
 Graphing the regions together, you find the following:
 And represented just as the overlapping region, you have:
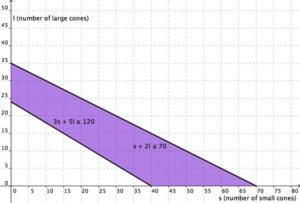
Answer
The region in purple is the solution. As long as the combination of small cones and large cones that Cathy sells can be mapped in the purple region, she will have earned at least [latex]$120[/latex] and not used more than [latex]70[/latex] scoops of ice cream.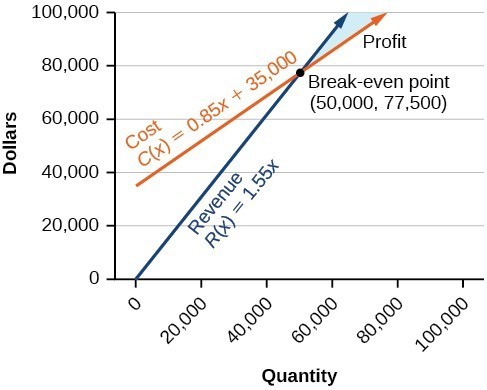 Note how the blue shaded region between the Cost and Revenue equations is labeled Profit. This is the "sweet spot" that the company wants to achieve where they produce enough bike frames at a minimal enough cost to make money. They don't want more money going out than coming in!
Example
Define the profit region for the skateboard manufacturing business using inequalities, given the system of linear equations: Cost: [latex]y=0.85x+35,000[/latex] Revenue: [latex]y=1.55x[/latex] [latex-display]x\ge0, y\ge0[/latex-display]Answer:
We know that graphically, solutions to linear inequalities are entire regions, and we learned how to graph systems of linear inequalities earlier in this module. Based on the graph below and the equations that define cost and revenue, we can use inequalities to define the region for which the skateboard manufacturer will make a profit. Again, not how only the region for [latex]x\ge0, y\ge0[/latex] is included.
 Let's start with the revenue equation. We know that the break even point is at [latex](50,000, 77,500)[/latex] and the profit region is the blue area. If we choose a point in the region and test it like we did for finding solution regions to inequalities, we will know which kind of inequality sign to use.
Let's test the point [latex]\left(65,00,100,000\right)[/latex] in both equations to determine which inequality sign to use.
Cost:
Let's start with the revenue equation. We know that the break even point is at [latex](50,000, 77,500)[/latex] and the profit region is the blue area. If we choose a point in the region and test it like we did for finding solution regions to inequalities, we will know which kind of inequality sign to use.
Let's test the point [latex]\left(65,00,100,000\right)[/latex] in both equations to determine which inequality sign to use.
Cost:
[latex]\begin{array}{l}y=0.85x+{35,000}\\{100,000}\text{ ? }0.85\left(65,000\right)+35,000\\100,000\text{ ? }90,250\end{array}[/latex]
We need to use > because [latex]100,000[/latex] is greater than [latex]90,250[/latex] The cost inequality that will ensure the company makes profit - not just break even - is [latex]y>0.85x+35,000[/latex] Now test the point in the revenue equation: Revenue:[latex]\begin{array}{l}y=1.55x\\100,000\text{ ? }1.55\left(65,000\right)\\100,000\text{ ? }100,750\end{array}[/latex]
We need to use < because [latex]100,000[/latex] is less than [latex]100,750[/latex] The revenue inequality that will ensure the company makes profit - not just break even - is [latex]y<1.55x[/latex] The systems of inequalities that defines the profit region for the bike manufacturer:[latex]\begin{array}{l}y>0.85x+35,000\\y<1.55x\end{array}[/latex]
Answer
The cost to produce [latex]50,000[/latex] units is [latex]$77,500[/latex], and the revenue from the sales of [latex]50,000[/latex] units is also [latex]$77,500[/latex]. To make a profit, the business must produce and sell more than [latex]50,000[/latex] units. The system of linear inequalities that represents the number of units that the company must produce in order to earn a profit is: [latex-display]\begin{array}{l}y>0.85x+35,000\\y<1.55x\end{array}[/latex-display]Licenses & Attributions
CC licensed content, Original
- System of Equations App: Break-Even Point. Authored by: James Sousa (Mathispower4u.com) for Lumen Learning. License: CC BY: Attribution.
- Revision and Adaptation. Provided by: Lumen Learning License: CC BY: Attribution.
CC licensed content, Shared previously
- College Algebra. Provided by: OpenStax Authored by: Jay Abrams, et al.. Located at: https://openstax.org/textbooks/college-algebra.. License: CC BY: Attribution.
- Unit 14: Systems of Equations and Inequalities, from Developmental Math: An Open Program. Provided by: Monterey Institute of Technology and Education Located at: https://www.nroc.org/. License: CC BY: Attribution.
- Ex: Linear Inequality in Two Variables Application Problem (Phone Cost: Day and Night Minutes). Authored by: James Sousa (Mathispower4u.com) . License: CC BY: Attribution.
