Finding the Slope of a Line From Its Graph
Learning Outcomes
- Given the graph of a line, determine the slope of the line
- Identify the slope of a horizontal line given it's equation
- Identify the slope of a vertical line given it's equation
Now we’ll look at some graphs on a coordinate grid to find their slopes. The method will be very similar to what we just modeled on our geoboards.
Doing the Manipulative Mathematics activity "Slope of Lines Between Two Points" will help you develop a better understanding of how to find the slope of a line from its graph.
To find the slope, we must count out the rise and the run. But where do we start?
We locate any two points on the line. We try to choose points with coordinates that are integers to make our calculations easier. We then start with the point on the left and sketch a right triangle, so we can count the rise and run.
example
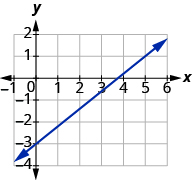
Find the slope of the line shown:
Solution
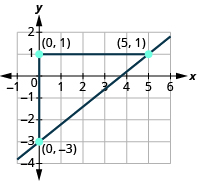
Locate two points on the graph, choosing points whose coordinates are integers. We will use [latex]\left(0,-3\right)[/latex] and [latex]\left(5,1\right)[/latex].
Starting with the point on the left, [latex]\left(0,-3\right)[/latex], sketch a right triangle, going from the first point to the second point, [latex]\left(5,1\right)[/latex].
 |
| Count the rise on the vertical leg of the triangle. |
The rise is [latex]4[/latex] units. |
| Count the run on the horizontal leg. |
The run is [latex]5[/latex] units. |
| Use the slope formula. |
[latex]m=\frac{\text{rise}}{\text{run}}[/latex] |
| Substitute the values of the rise and run. |
[latex]m=\frac{4}{5}[/latex] |
| The slope of the line is [latex]\frac{4}{5}[/latex] . |
Notice that the slope is positive since the line slants upward from left to right.
try it
[ohm_question]147014[/ohm_question]
Find the slope from a graph
- Locate two points on the line whose coordinates are integers.
- Starting with the point on the left, sketch a right triangle, going from the first point to the second point.
- Count the rise and the run on the legs of the triangle.
- Take the ratio of rise to run to find the slope. [latex]m=\frac{\text{rise}}{\text{run}}[/latex]
example
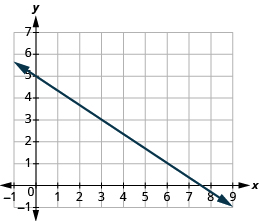
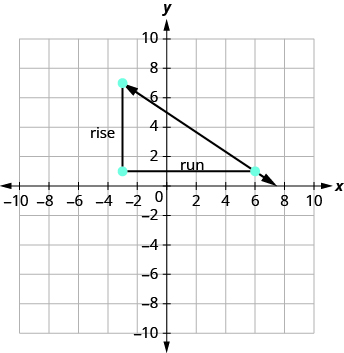
Find the slope of the line shown:
Answer:
Solution
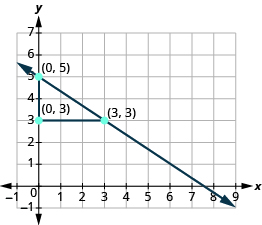
Locate two points on the graph. Look for points with coordinates that are integers. We can choose any points, but we will use [latex](0, 5)[/latex] and [latex](3, 3)[/latex]. Starting with the point on the left, sketch a right triangle, going from the first point to the second point.
 |
| Count the rise – it is negative. |
The rise is [latex]−2[/latex]. |
| Count the run. |
The run is [latex]3[/latex]. |
| Use the slope formula. |
[latex]m=\frac{\text{rise}}{\text{run}}[/latex] |
| Substitute the values of the rise and run. |
[latex]m=\frac{-2}{3}[/latex] |
| Simplify. |
[latex]m=-\frac{2}{3}[/latex] |
| The slope of the line is [latex]-\frac{2}{3}[/latex]. |
Notice that the slope is negative since the line slants downward from left to right.
What if we had chosen different points? Let’s find the slope of the line again, this time using different points. We will use the points [latex]\left(-3,7\right)[/latex] and [latex]\left(6,1\right)[/latex].
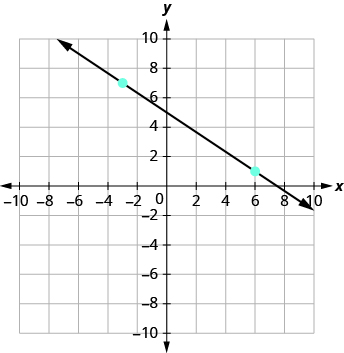 Starting at [latex]\left(-3,7\right)[/latex], sketch a right triangle to [latex]\left(6,1\right)[/latex].
 |
| Count the rise. |
The rise is [latex]−6[/latex]. |
| Count the run. |
The run is [latex]9[/latex]. |
| Use the slope formula. |
[latex]m=\frac{\text{rise}}{\text{run}}[/latex] |
| Substitute the values of the rise and run. |
[latex]m=\frac{-6}{9}[/latex] |
| Simplify the fraction. |
[latex]m=-\frac{2}{3}[/latex] |
| The slope of the line is [latex]-\frac{2}{3}[/latex]. |
It does not matter which points you use—the slope of the line is always the same. The slope of a line is constant!
try it
[ohm_question]147015[/ohm_question]
The lines in the previous examples had [latex]y[/latex] -intercepts with integer values, so it was convenient to use the y-intercept as one of the points we used to find the slope. In the next example, the [latex]y[/latex] -intercept is a fraction. The calculations are easier if we use two points with integer coordinates.
example
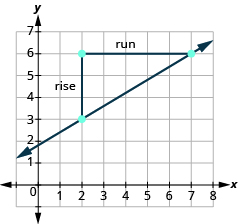
Find the slope of the line shown:

Answer:
Solution
| Locate two points on the graph whose coordinates are integers. |
[latex]\left(2,3\right)[/latex] and [latex]\left(7,6\right)[/latex] |
| Which point is on the left? |
[latex]\left(2,3\right)[/latex] |
| Starting at [latex]\left(2,3\right)[/latex] , sketch a right angle to [latex]\left(7,6\right)[/latex] as shown below. |
 |
| Count the rise. |
The rise is [latex]3[/latex]. |
| Count the run. |
The run is [latex]5[/latex]. |
| Use the slope formula. |
[latex]m=\frac{\text{rise}}{\text{run}}[/latex] |
| Substitute the values of the rise and run. |
[latex]m=\frac{3}{5}[/latex] |
| The slope of the line is [latex]\frac{3}{5}[/latex]. |
try it
[ohm_question]147016[/ohm_question]
Finding the Slope of Horizontal and Vertical Lines
Do you remember what was special about horizontal and vertical lines? Their equations had just one variable.
- horizontal line [latex]y=b[/latex]; all the [latex]y[/latex] -coordinates are the same.
- vertical line [latex]x=a[/latex]; all the [latex]x[/latex] -coordinates are the same.
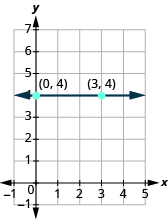
So how do we find the slope of the horizontal line [latex]y=4?[/latex] One approach would be to graph the horizontal line, find two points on it, and count the rise and the run. Let’s see what happens. We’ll use the two points [latex]\left(0,4\right)[/latex] and [latex]\left(3,4\right)[/latex] to count the rise and run.
| What is the rise? |
The rise is [latex]0[/latex]. |
| What is the run? |
The run is [latex]3[/latex]. |
| What is the slope? |
[latex]m=\frac{\text{rise}}{\text{run}}[/latex] |
| [latex]m=\frac{0}{3}[/latex] |
| [latex]m=0[/latex] |
The slope of the horizontal line [latex]y=4[/latex] is [latex]0[/latex].
All horizontal lines have slope [latex]0[/latex] . When the [latex]y[/latex] -coordinates are the same, the rise is [latex]0[/latex] .
Slope of a Horizontal Line
The slope of a horizontal line, [latex]y=b[/latex], is [latex]0[/latex].
Now we’ll consider a vertical line, such as the line [latex]x=3[/latex], shown below. We’ll use the two points [latex]\left(3,0\right)[/latex] and [latex]\left(3,2\right)[/latex] to count the rise and run.
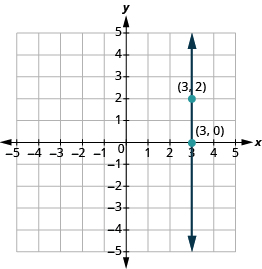
| What is the rise? |
The rise is [latex]2[/latex]. |
| What is the run? |
The run is [latex]0[/latex]. |
| What is the slope? |
[latex]m=\frac{\text{rise}}{\text{run}}[/latex] |
| [latex]m=\frac{2}{0}[/latex] |
But we can’t divide by [latex]0[/latex]. Division by [latex]0[/latex] is undefined. So we say that the slope of the vertical line [latex]x=3[/latex] is undefined. The slope of all vertical lines is undefined, because the run is [latex]0[/latex].
Slope of a Vertical Line
The slope of a vertical line, [latex]x=a[/latex], is undefined.
example
Find the slope of each line:
1. [latex]x=8[/latex]
2. [latex]y=-5[/latex]
Solution
1. [latex]x=8[/latex]
This is a vertical line, so its slope is undefined.
2. [latex]y=-5[/latex]
This is a horizontal line, so its slope is [latex]0[/latex].
try it
[ohm_question]147020[/ohm_question]
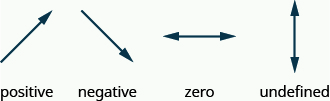
Quick Guide to the Slopes of Lines
Licenses & Attributions
CC licensed content, Original
- Question ID 147016, 147015, 147014,147013, 147020. Authored by: Lumen Learning. License: CC BY: Attribution.
CC licensed content, Specific attribution
