Horizontal and Vertical Shifts of Logarithmic Functions
Learning Objectives
- Graph horizontal and vertical shifts of logarithmic functions
Graphing a Horizontal Shift of [latex]f\left(x\right)={\mathrm{log}}_{b}\left(x\right)[/latex]
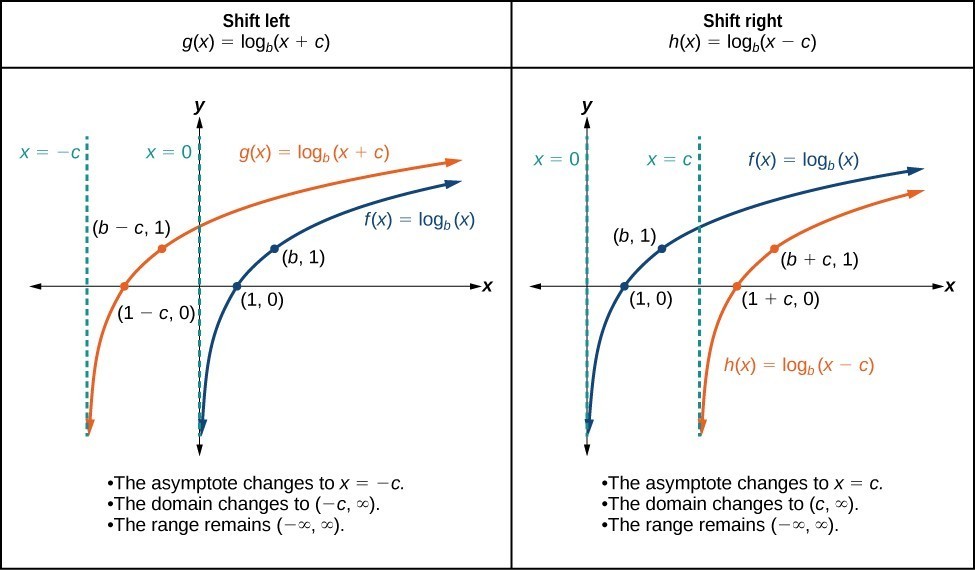
When a constant c is added to the input of the parent function [latex]f\left(x\right)=\text{log}_{b}\left(x\right)[/latex], the result is a horizontal shift c units in the opposite direction of the sign on c. To visualize horizontal shifts, we can observe the general graph of the parent function [latex]f\left(x\right)={\mathrm{log}}_{b}\left(x\right)[/latex] and for c > 0 alongside the shift left, [latex]g\left(x\right)={\mathrm{log}}_{b}\left(x+c\right)[/latex], and the shift right, [latex]h\left(x\right)={\mathrm{log}}_{b}\left(x-c\right)[/latex].Try it
In the graphs below, you can use the slider for the variable c to investigate horizontal shifts that are produced by either adding or subtracting a constant from the input of a logarithmic function. The function [latex]f(x) = \log_{b}{x+c}[/latex] represents adding c units to the input of the function, and the function [latex]g(x) = \log_{b}{x-c}[/latex] represents subtracting c units from the input of the function. Investigate the following questions:- Adjust the slider for c to 4.
- Which direction does the graph of [latex]f(x)[/latex]shift? What is the vertical asymptote, x-intercept, and equation for this new function? How do the domain and range change?
- Which direction does the graph of [latex]g(x)[/latex] shift? What is the vertical asymptote, x-intercept, and equation for this new function? How do the domain and range change?
A General Note: Horizontal Shifts of the Parent Function [latex]y=\text{log}_{b}\left(x\right)[/latex]
For any constant c, the function [latex]f\left(x\right)={\mathrm{log}}_{b}\left(x+c\right)[/latex]- shifts the parent function [latex]y={\mathrm{log}}_{b}\left(x\right)[/latex] left c units if c > 0.
- shifts the parent function [latex]y={\mathrm{log}}_{b}\left(x\right)[/latex] right c units if c < 0.
- has the vertical asymptote x = –c.
- has domain [latex]\left(-c,\infty \right)[/latex].
- has range [latex]\left(-\infty ,\infty \right)[/latex].
How To: Given a logarithmic function with the form [latex]f\left(x\right)={\mathrm{log}}_{b}\left(x+c\right)[/latex], graph the translation.
- Identify the horizontal shift:
- If c > 0, shift the graph of [latex]f\left(x\right)={\mathrm{log}}_{b}\left(x\right)[/latex] left c units.
- If c < 0, shift the graph of [latex]f\left(x\right)={\mathrm{log}}_{b}\left(x\right)[/latex] right c units.
- Draw the vertical asymptote x = –c.
- Identify three key points from the parent function. Find new coordinates for the shifted functions by subtracting c from the x coordinate.
- Label the three points.
- The Domain is [latex]\left(-c,\infty \right)[/latex], the range is [latex]\left(-\infty ,\infty \right)[/latex], and the vertical asymptote is x = –c.
Example: Graphing a Horizontal Shift of the Parent Function [latex]y=\text{log}_{b}\left(x\right)[/latex]
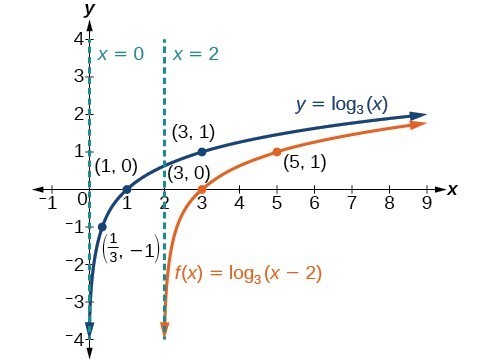
Sketch the horizontal shift [latex]f\left(x\right)={\mathrm{log}}_{3}\left(x - 2\right)[/latex] alongside its parent function. Include the key points and asymptotes on the graph. State the domain, range, and asymptote.Answer:
Since the function is [latex]f\left(x\right)={\mathrm{log}}_{3}\left(x - 2\right)[/latex], we notice [latex]x+\left(-2\right)=x - 2[/latex].
Thus c = –2, so c < 0. This means we will shift the function [latex]f\left(x\right)={\mathrm{log}}_{3}\left(x\right)[/latex] right 2 units.
The vertical asymptote is [latex]x=-\left(-2\right)[/latex] or x = 2.
Consider the three key points from the parent function, [latex]\left(\frac{1}{3},-1\right)[/latex], [latex]\left(1,0\right)[/latex], and [latex]\left(3,1\right)[/latex].
The new coordinates are found by adding 2 to the x coordinates.
Label the points [latex]\left(\frac{7}{3},-1\right)[/latex], [latex]\left(3,0\right)[/latex], and [latex]\left(5,1\right)[/latex].
The domain is [latex]\left(2,\infty \right)[/latex], the range is [latex]\left(-\infty ,\infty \right)[/latex], and the vertical asymptote is x = 2.
Try It
Sketch a graph of [latex]f\left(x\right)={\mathrm{log}}_{3}\left(x+4\right)[/latex] alongside its parent function. Include the key points and asymptotes on the graph. State the domain, range, and asymptote.Answer:
The domain is [latex]\left(-4,\infty \right)[/latex], the range [latex]\left(-\infty ,\infty \right)[/latex], and the asymptote x = –4.

Graphing a Vertical Shift of [latex]y=\text{log}_{b}\left(x\right)[/latex]
When a constant d is added to the parent function [latex]f\left(x\right)={\mathrm{log}}_{b}\left(x\right)[/latex], the result is a vertical shift d units in the direction of the sign on d. To visualize vertical shifts, we can observe the general graph of the parent function [latex]f\left(x\right)={\mathrm{log}}_{b}\left(x\right)[/latex] alongside the shift up, [latex]g\left(x\right)={\mathrm{log}}_{b}\left(x\right)+d[/latex] and the shift down, [latex]h\left(x\right)={\mathrm{log}}_{b}\left(x\right)-d[/latex].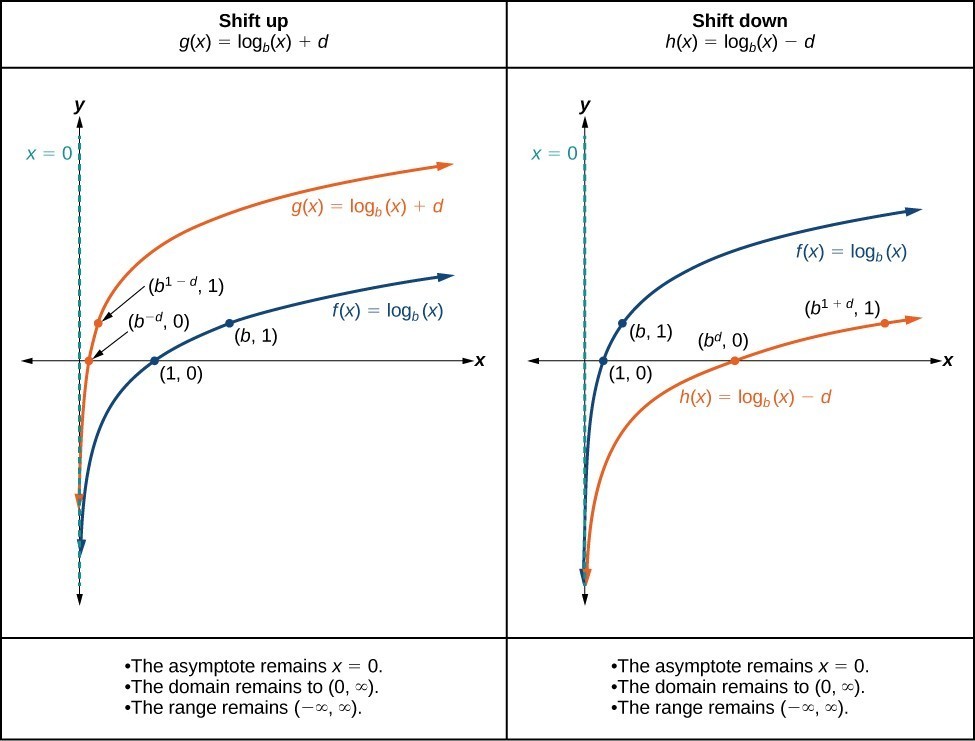
A General Note: Vertical Shifts of the Parent Function [latex]y=\text{log}_{b}\left(x\right)[/latex]
For any constant d, the function [latex]f\left(x\right)={\mathrm{log}}_{b}\left(x\right)+d[/latex]- shifts the parent function [latex]y={\mathrm{log}}_{b}\left(x\right)[/latex] up d units if d > 0.
- shifts the parent function [latex]y={\mathrm{log}}_{b}\left(x\right)[/latex] down d units if d < 0.
- has the vertical asymptote x = 0.
- has domain [latex]\left(0,\infty \right)[/latex].
- has range [latex]\left(-\infty ,\infty \right)[/latex].
How To: Given a logarithmic function with the form [latex]f\left(x\right)={\mathrm{log}}_{b}\left(x\right)+d[/latex], graph the translation.
- Identify the vertical shift:
- If d > 0, shift the graph of [latex]f\left(x\right)={\mathrm{log}}_{b}\left(x\right)[/latex] up d units.
- If d < 0, shift the graph of [latex]f\left(x\right)={\mathrm{log}}_{b}\left(x\right)[/latex] down d units.
- Draw the vertical asymptote x = 0.
- Identify three key points from the parent function. Find new coordinates for the shifted functions by adding d to the y coordinate.
- Label the three points.
- The domain is [latex]\left(0,\infty \right)[/latex], the range is [latex]\left(-\infty ,\infty \right)[/latex], and the vertical asymptote is x = 0.
Example: Graphing a Vertical Shift of the Parent Function [latex]y=\text{log}_{b}\left(x\right)[/latex]
Sketch a graph of [latex]f\left(x\right)={\mathrm{log}}_{3}\left(x\right)-2[/latex] alongside its parent function. Include the key points and asymptote on the graph. State the domain, range, and asymptote.Answer: Since the function is [latex]f\left(x\right)={\mathrm{log}}_{3}\left(x\right)-2[/latex], we will notice d = –2. Thus d < 0. This means we will shift the function [latex]f\left(x\right)={\mathrm{log}}_{3}\left(x\right)[/latex] down 2 units. The vertical asymptote is x = 0. Consider the three key points from the parent function, [latex]\left(\frac{1}{3},-1\right)[/latex], [latex]\left(1,0\right)[/latex], and [latex]\left(3,1\right)[/latex]. The new coordinates are found by subtracting 2 from the y coordinates. Label the points [latex]\left(\frac{1}{3},-3\right)[/latex], [latex]\left(1,-2\right)[/latex], and [latex]\left(3,-1\right)[/latex].
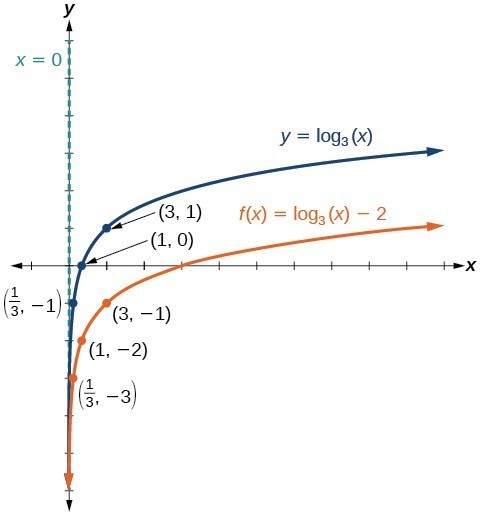 The domain is [latex]\left(0,\infty \right)[/latex], the range is [latex]\left(-\infty ,\infty \right)[/latex], and the vertical asymptote is x = 0.
Try It
Sketch a graph of [latex]f\left(x\right)={\mathrm{log}}_{2}\left(x\right)+2[/latex] alongside its parent function. Include the key points and asymptote on the graph. State the domain, range, and asymptote.Answer: The domain is [latex]\left(0,\infty \right)[/latex], the range is [latex]\left(-\infty ,\infty \right)[/latex], and the vertical asymptote is x = 0.

Licenses & Attributions
CC licensed content, Original
- Revision and Adaptation. Provided by: Lumen Learning License: CC BY: Attribution.
- Horizontal and Vertical Shifts of Logarithmic Functions Interactive. Authored by: Lumen Learning. Located at: https://www.desmos.com/calculator/6drjq3bh0m. License: Public Domain: No Known Copyright.
CC licensed content, Shared previously
- Question ID 74340, 74341. Authored by: Nearing,Daniel, mb Meacham,William, mb Lippman,David. License: CC BY: Attribution. License terms: IMathAS Community License CC-BY +GPL.
- College Algebra. Provided by: OpenStax Authored by: Abramson, Jay et al.. Located at: https://openstax.org/books/college-algebra/pages/1-introduction-to-prerequisites. License: CC BY: Attribution. License terms: Download for free at http://cnx.org/contents/[email protected].
