We've updated our
Privacy Policy effective December 15. Please read our updated Privacy Policy and tap

TEXT

Study Guides > College Algebra

Introduction to Graphs of Linear Functions

Learning Objectives

Graphs of Linear Functions
  • Graph linear functions by plotting points, using the slope and y-intercept, and by using transformations
  • Write the equation of a linear function given its graph, including vertical and horizontal lines, match linear equations with their graphs
  • Find the equations of vertical and horizontal lines
  • Graph an absolute value function, find its intercepts
  We can now describe a variety of characteristics that explain the behavior of linear functions. We will use this information to analyze a graphed line and write an equation based on its observable properties. From evaluating the graph, what can you determine about this linear function?
  • Graph of the function f(x)= frac {2}{3} x plus 1
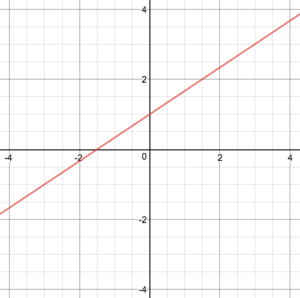
initial value (y-intercept)?
  • one or two points?
  • slope?
  • increasing or decreasing?
  • vertical or horizontal?
In this section, you will practice writing liner function equations using the information you've gathered. We will also practice graphing linear functions using different methods and predict how the graphs of linear functions will change when parts of the equation are altered.  

Licenses & Attributions

CC licensed content, Original

CC licensed content, Shared previously

  • College Algebra. Provided by: OpenStax Authored by: Abramson, Jay et al.. Located at: https://openstax.org/books/college-algebra/pages/1-introduction-to-prerequisites. License: CC BY: Attribution. License terms: Download for free at http://cnx.org/contents/[email protected].