Horizontal and Vertical Translations of Exponential Functions
Learning Objectives
- Graph exponential functions shifted horizontally or vertically and write the associated equation
Graphing a Vertical Shift
The first transformation occurs when we add a constant d to the parent function [latex]f\left(x\right)={b}^{x}[/latex], giving us a vertical shift d units in the same direction as the sign. For example, if we begin by graphing a parent function, [latex]f\left(x\right)={2}^{x}[/latex], we can then graph two vertical shifts alongside it, using [latex]d=3[/latex]: the upward shift, [latex]g\left(x\right)={2}^{x}+3[/latex] and the downward shift, [latex]h\left(x\right)={2}^{x}-3[/latex]. Both vertical shifts are shown in the figure below.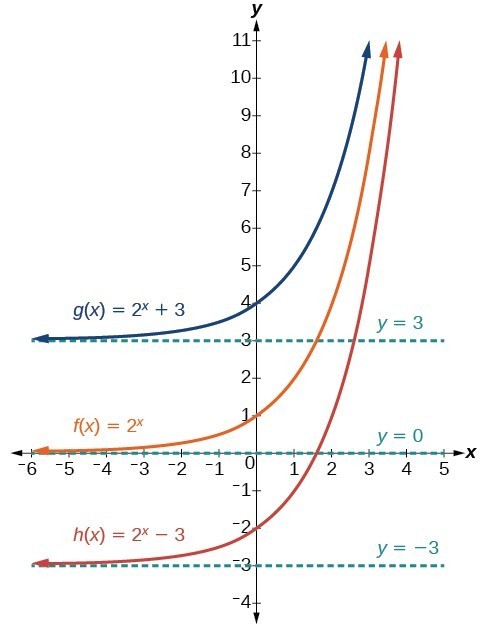 Observe the results of shifting [latex]f\left(x\right)={2}^{x}[/latex] vertically:
- The domain, [latex]\left(-\infty ,\infty \right)[/latex] remains unchanged.
- When the function is shifted up 3 units to [latex]g\left(x\right)={2}^{x}+3[/latex]:
- The y-intercept shifts up 3 units to [latex]\left(0,4\right)[/latex].
- The asymptote shifts up 3 units to [latex]y=3[/latex].
- The range becomes [latex]\left(3,\infty \right)[/latex].
- When the function is shifted down 3 units to [latex]h\left(x\right)={2}^{x}-3[/latex]:
- The y-intercept shifts down 3 units to [latex]\left(0,-2\right)[/latex].
- The asymptote also shifts down 3 units to [latex]y=-3[/latex].
- The range becomes [latex]\left(-3,\infty \right)[/latex].
Try it
- Use the slider in the graph below to create a graph of [latex]f(x) = 2^x[/latex] that has been shifted 4 units up. Add a line that represents the horizontal asymptote for this function. What is the equation for this function? What is the new y-intercept? What is it's domain and range?
- Now create a graph of the function [latex]f(x) = 2^x[/latex] that has been shifted down 2 units. Add a line that represents the horizontal asymptote.What is the equation for this function? What is the new y-intercept? What is it's domain and range?
Answer:
- Equation: [latex]f(x) = 2^x+4[/latex], Horizontal Asymptote: [latex]y = 4[/latex], y-intercept: [latex](0,5)[/latex]Domain: [latex](-\infty,\infty)[/latex], Range: [latex](4,\infty)[/latex]
- Equation: [latex]f(x) = 2^x-2[/latex], Horizontal Asymptote: [latex]y = -2[/latex], y-intercept: [latex](0,-1)[/latex]Domain: [latex](-\infty,\infty)[/latex], Range: [latex](-2,\infty)[/latex]
Graphing a Horizontal Shift
The next transformation occurs when we add a constant c to the input of the parent function [latex]f\left(x\right)={b}^{x}[/latex], giving us a horizontal shift c units in the opposite direction of the sign. For example, if we begin by graphing the parent function [latex]f\left(x\right)={2}^{x}[/latex], we can then graph two horizontal shifts alongside it, using [latex]c=3[/latex]: the shift left, [latex]g\left(x\right)={2}^{x+3}[/latex], and the shift right, [latex]h\left(x\right)={2}^{x - 3}[/latex]. Both horizontal shifts are shown in the figure below.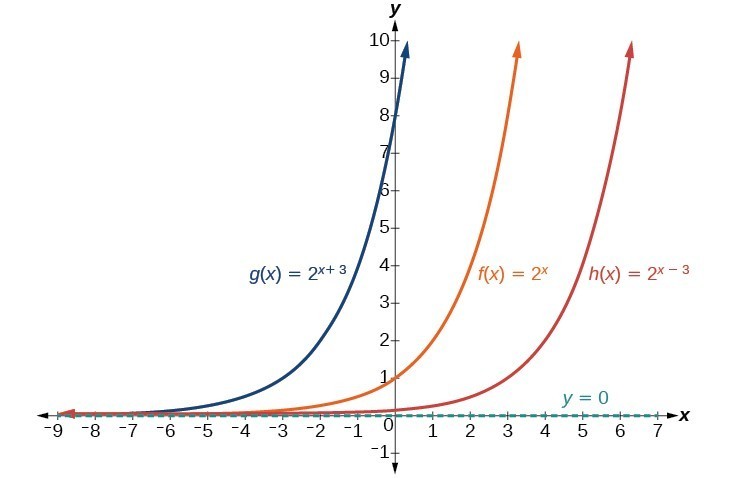 Observe the results of shifting [latex]f\left(x\right)={2}^{x}[/latex] horizontally:
- The domain, [latex]\left(-\infty ,\infty \right)[/latex], remains unchanged.
- The asymptote, [latex]y=0[/latex], remains unchanged.
- The y-intercept shifts such that:
- When the function is shifted left 3 units to [latex]g\left(x\right)={2}^{x+3}[/latex], the y-intercept becomes [latex]\left(0,8\right)[/latex]. This is because [latex]{2}^{x+3}=\left(8\right){2}^{x}[/latex], so the initial value of the function is 8.
- When the function is shifted right 3 units to [latex]h\left(x\right)={2}^{x - 3}[/latex], the y-intercept becomes [latex]\left(0,\frac{1}{8}\right)[/latex]. Again, see that [latex]{2}^{x - 3}=\left(\frac{1}{8}\right){2}^{x}[/latex], so the initial value of the function is [latex]\frac{1}{8}[/latex].
try it
- Use the slider in the graph below to create a graph of [latex]f(x) = 2^x[/latex] that has been shifted 4 units to the right. What is the equation for this function? What is the new y-intercept? What are it's domain and range?
- Use the slider in the graph below to create a graph of [latex]f(x) = 2^x[/latex] that has been shifted 3 units to the left. What is the equation for this function? What is the new y-intercept? What are it's domain and range?
Answer:
- Equation: [latex]f(x) = 2^{x-4}[/latex], y-intercept: [latex](0,\frac{1}{32})[/latex]Domain: [latex](-\infty,\infty)[/latex], Range: [latex](0,\infty)[/latex]
- Equation: [latex]f(x) = 2^{x+3}[/latex], y-intercept: [latex](0,8)[/latex]Domain: [latex](-\infty,\infty)[/latex], Range: [latex](0,\infty)[/latex]
A General Note: Shifts of the Parent Function [latex]f\left(x\right)={b}^{x}[/latex]
For any constants c and d, the function [latex]f\left(x\right)={b}^{x+c}+d[/latex] shifts the parent function [latex]f\left(x\right)={b}^{x}[/latex]- vertically d units, in the same direction of the sign of d.
- horizontally c units, in the opposite direction of the sign of c.
- The y-intercept becomes [latex]\left(0,{b}^{c}+d\right)[/latex].
- The horizontal asymptote becomes y = d.
- The range becomes [latex]\left(d,\infty \right)[/latex].
- The domain, [latex]\left(-\infty ,\infty \right)[/latex], remains unchanged.
How To: Given an exponential function with the form [latex]f\left(x\right)={b}^{x+c}+d[/latex], graph the translation.
- Draw the horizontal asymptote y = d.
- Identify the shift as [latex]\left(-c,d\right)[/latex]. Shift the graph of [latex]f\left(x\right)={b}^{x}[/latex] left c units if c is positive, and right [latex]c[/latex] units if c is negative.
- Shift the graph of [latex]f\left(x\right)={b}^{x}[/latex] up d units if d is positive, and down d units if d is negative.
- State the domain, [latex]\left(-\infty ,\infty \right)[/latex], the range, [latex]\left(d,\infty \right)[/latex], and the horizontal asymptote [latex]y=d[/latex].
Example: Graphing a Shift of an Exponential Function
Graph [latex]f\left(x\right)={2}^{x+1}-3[/latex]. State the domain, range, and asymptote.Answer: We have an exponential equation of the form [latex]f\left(x\right)={b}^{x+c}+d[/latex], with [latex]b=2[/latex], [latex]c=1[/latex], and [latex]d=-3[/latex]. Draw the horizontal asymptote [latex]y=d[/latex], so draw [latex]y=-3[/latex]. Identify the shift as [latex]\left(-c,d\right)[/latex], so the shift is [latex]\left(-1,-3\right)[/latex].
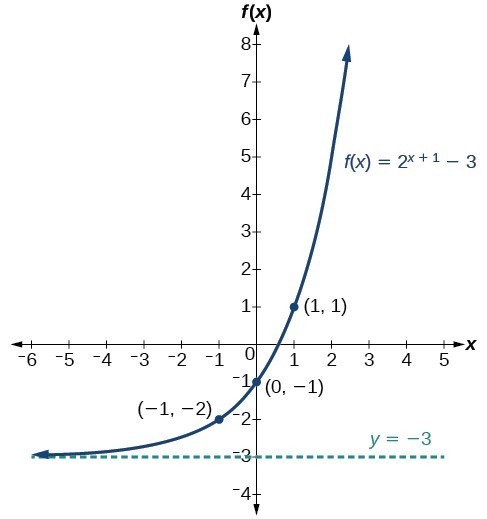 The domain is [latex]\left(-\infty ,\infty \right)[/latex]; the range is [latex]\left(-3,\infty \right)[/latex]; the horizontal asymptote is [latex]y=-3[/latex].
Try It
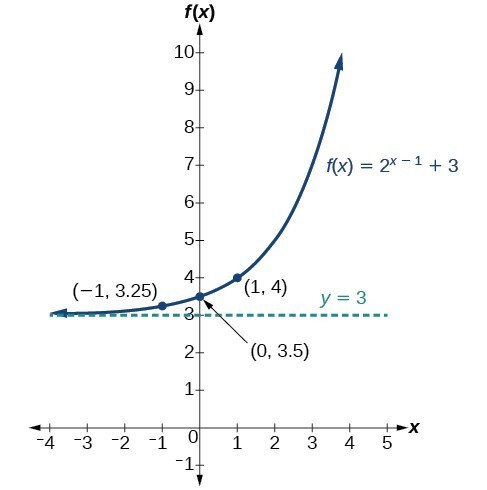
Use the sliders in the graph below to create a graph of the function [latex]f\left(x\right)={2}^{x - 1}+3[/latex]. State domain, range, and asymptote. https://www.desmos.com/calculator/e5l4eca3obAnswer:
The domain is [latex]\left(-\infty ,\infty \right)[/latex]; the range is [latex]\left(3,\infty \right)[/latex]; the horizontal asymptote is y = 3.
Use a Graph to Approximate a Solution to an Exponential Equation
Graphing can help you confirm or find the solution to an exponential equation. An exponential equation is different from a function because a function is a large collection of points made of inputs and corresponding outputs, whereas equations that you have seen typically have one, two, or no solutions. For example, [latex]f(x)=2^{x}[/latex] is a function and is comprised of many points [latex](x,f(x))[/latex], and [latex]4=2^{x}[/latex] can be solved to find the specific value for x that makes it a true statement. The graph below shows the intersection of the line [latex]f(x)=4[/latex], and [latex]f(x)=2^{x}[/latex], you can see they cross at [latex]y=4[/latex]. https://www.desmos.com/calculator/lhmpdkbjt0 In the next example, you can try this for yourself.Example : Approximating the Solution of an Exponential Equation
Use Desmos to solve [latex]42=1.2{\left(5\right)}^{x}+2.8[/latex] graphically.Answer: First, graph the function [latex]f(x)=1.2{\left(5\right)}^{x}+2.8[/latex] , then add another function [latex]f(x) = 42[/latex]. Desmos automatically calculates points of interest including intersections. Essentially, you are looking for the intersection of two functions. Click on the point of intersection, and you will see the the x and y values for the point. Your graph will look like this: https://www.desmos.com/calculator/ozaejvejqn
Try It
Solve [latex]4=7.85{\left(1.15\right)}^{x}-2.27[/latex] graphically. Round to the nearest thousandth.Answer: [latex]x\approx -1.608[/latex]
Licenses & Attributions
CC licensed content, Original
- Revision and Adaptation. Provided by: Lumen Learning License: CC BY: Attribution.
- Horizontal and Vertical Translations of Exponential Functions Interactive. Authored by: Lumen Learning. Located at: https://www.desmos.com/calculator/5mrjqegkxk. License: Public Domain: No Known Copyright.
- Horizontal and Vertical Translations of Exponential Functions 2 Interactive. Authored by: Lumen Learning. Located at: https://www.desmos.com/calculator/rpv1kea0pz. License: Public Domain: No Known Copyright.
- Horizontal and Vertical Translations of Exponential Functions 3 Interactive. Authored by: Lumen Learning. Located at: https://www.desmos.com/calculator/e5l4eca3ob. License: Public Domain: No Known Copyright.
- Solve Exponential Interactive. Authored by: Lumen Learning. Located at: https://www.desmos.com/calculator/lhmpdkbjt0. License: Public Domain: No Known Copyright.
- Horizontal and Vertical Translations of Exponential Functions 4 Interactive. Authored by: Lumen Learning. Located at: https://www.desmos.com/calculator/ozaejvejqn. License: Public Domain: No Known Copyright.
CC licensed content, Shared previously
- College Algebra. Provided by: OpenStax Authored by: Abramson, Jay et al.. Located at: https://openstax.org/books/college-algebra/pages/1-introduction-to-prerequisites. License: CC BY: Attribution. License terms: Download for free at http://cnx.org/contents/[email protected].
- Question ID 63064. Authored by: Brin,Leon. License: CC BY: Attribution. License terms: IMathAS Community License CC-BY + GPL.
- Ex: Match the Graphs of Translated Exponential Function to Equations. Authored by: James Sousa (Mathispower4u.com). License: CC BY: Attribution.
