Graphing a Line Using Slope and a Point
Learning Outcomes
- Draw the graph of a line using slope and a point on the line
- Write the equation of a line using slope and y-intercept
Graphing a Line Using Slope and a Point on the Line
Another method we can use to graph lines is the point-slope method. Sometimes, we will be given one point and the slope of the line, instead of its equation. When this happens, we use the definition of slope to draw the graph of the line.example
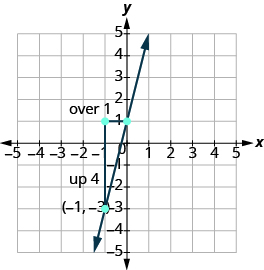
Graph the line passing through the point [latex]\left(1,-1\right)[/latex] whose slope is [latex]m=\Large\frac{3}{4}[/latex]. Solution Plot the given point, [latex]\left(1,-1\right)[/latex].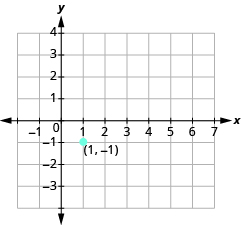 Use the slope formula [latex]m=\Large\frac{\text{rise}}{\text{run}}[/latex] to identify the rise and the run.
[latex]\begin{array}{}\\ \\ m=\frac{3}{4}\hfill \\ \frac{\text{rise}}{\text{run}}=\frac{3}{4}\hfill \\ \\ \\ \text{rise}=3\hfill \\ \text{run}=4\hfill \end{array}[/latex]
Starting at the point we plotted, count out the rise and run to mark the second point. We count [latex]3[/latex] units up and [latex]4[/latex] units right.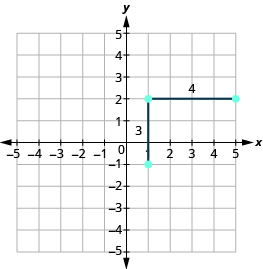 Then we connect the points with a line and draw arrows at the ends to show it continues.
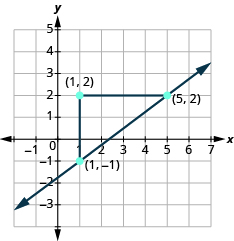 We can check our line by starting at any point and counting up [latex]3[/latex] and to the right [latex]4[/latex]. We should get to another point on the line.
try it
[ohm_question]147024[/ohm_question]Graph a line given a point and a slope
-
- Plot the given point.
- Use the slope formula to identify the rise and the run.
- Starting at the given point, count out the rise and run to mark the second point.
- Connect the points with a line.
example
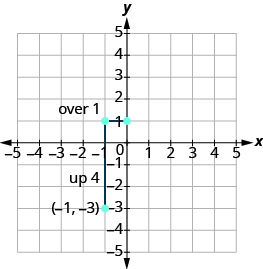
Graph the line passing through the point [latex]\left(-1,-3\right)[/latex] whose slope is [latex]m=4[/latex]Answer:
Solution
Plot the given point.

| Identify the rise and the run. | [latex]m=4[/latex] |
| Write [latex]4[/latex] as a fraction. | [latex]\Large\frac{\text{rise}}{\text{run}}\normalsize=\Large\frac{4}{1}[/latex] |
| [latex]\text{rise}=4\text{ run}=1[/latex] |
 Mark the second point. Connect the two points with a line.
try it
[ohm_question]147026[/ohm_question]example
Graph the line with [latex]y[/latex] -intercept [latex]\left(0,2\right)[/latex] and slope [latex]m=-\Large\frac{2}{3}[/latex]Answer:
Solution
Plot the given point, the [latex]y[/latex] -intercept [latex]\left(0,2\right)[/latex].
 Use the slope formula [latex]m=\Large\frac{\text{rise}}{\text{run}}[/latex] to identify the rise and the run.
[latex]\begin{array}{}\\ \\ m=-\frac{2}{3}\hfill \\ \frac{\text{rise}}{\text{run}}=\frac{-2}{3}\hfill \\ \\ \\ \text{rise}=-2\hfill \\ \text{run}=3\hfill \end{array}[/latex]
Starting at [latex]\left(0,2\right)[/latex], count the rise and the run and mark the second point.
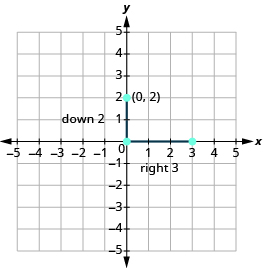 Connect the points with a line.
try it
[ohm_question]147025[/ohm_question]Slope-Intercept Form
We will now show you what is so special about the case in which the given point is the y-intercept. The slope can be represented by m and the y-intercept, where it crosses the axis and [latex]x=0[/latex], can be represented by [latex](0,b)[/latex] where b is the value where the graph crosses the vertical y-axis. Any other point on the line can be represented by [latex](x,y)[/latex].Slope-Intercept Form of a Linear Equation
In the equation [latex]y=mx+b[/latex],- m is the slope of the graph.
- b is the y value of the y-intercept of the graph.
This formula is known as the slope-intercept equation. If we know the slope and the y-intercept we can easily find the equation that represents the line.
Example
Write the equation of the line that has a slope of [latex] \displaystyle \frac{1}{2}[/latex] and a y-intercept of [latex]−5[/latex].Answer: Substitute the slope (m) into [latex]y=mx+b[/latex].
[latex] \displaystyle y=\frac{1}{2}x+b[/latex]
Substitute the [latex]y[/latex]-intercept (b) into the equation.[latex] \displaystyle y=\frac{1}{2}x-5[/latex]
Answer
[latex-display]y=\frac{1}{2}x-5[/latex-display]Example
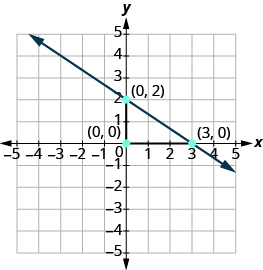
Write the equation of the line in the graph by identifying the slope and y-intercept.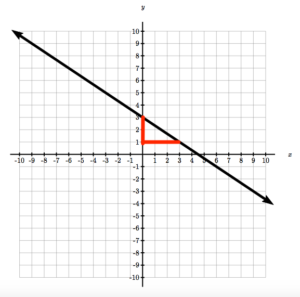
Answer: Identify the point where the graph crosses the y-axis [latex](0,3)[/latex]. This means the [latex]y[/latex]-intercept is [latex]3[/latex]. Identify one other point and draw a slope triangle to find the slope. The slope is [latex]\frac{-2}{3}[/latex] Substitute the slope and y value of the intercept into the slope-intercept equation.
[latex]y=mx+b\\y=\frac{-2}{3}x+b\\y=\frac{-2}{3}x+3[/latex]
Answer
[latex-display]y=\frac{-2}{3}x+3[/latex-display]Example
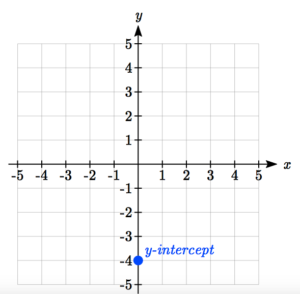
Graph [latex]y=\frac{1}{2}x-4[/latex] using the slope-intercept equation.Answer: First, plot the [latex]y[/latex]-intercept.
 Now use the slope to count up or down and over left or right to the next point. This slope is [latex]\frac{1}{2}[/latex], so you can count up one and right two—both positive because both parts of the slope are positive.
Connect the dots.
Now use the slope to count up or down and over left or right to the next point. This slope is [latex]\frac{1}{2}[/latex], so you can count up one and right two—both positive because both parts of the slope are positive.
Connect the dots.

Try It
[ohm_question]79774[/ohm_question]Contribute!
Licenses & Attributions
CC licensed content, Shared previously
- Slope-Intercept Form of a Line. Authored by: Mathispower4u. License: Public Domain: No Known Copyright.
CC licensed content, Specific attribution
- Beginning and Intermediate Algebra. Authored by: Tyler Wallace. License: CC BY: Attribution.
