Graphing Piecewise Functions
Learning Outcomes
- Write a piecewise function given an application
- Graph a piecewise function using domain
How To: Given a piecewise function, sketch a graph
- Indicate on the x-axis the boundaries defined by the intervals on each piece of the domain.
- For each piece of the domain, graph the corresponding equation on that interval. Do not graph two functions over one interval because it would violate the criteria of a function.
Example
Sketch a graph of the function and state its domain and range. Given the piecewise definition [latex]f(x)=\begin{cases}−x − 3\text{ if }x < −3\\ x + 3\text{ if } x \ge −3\end{cases}[/latex]Answer:
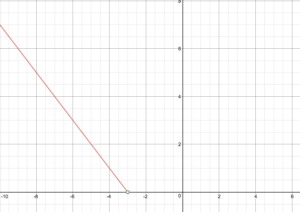
First, graph the line [latex]f(x) = −x−3[/latex] erasing the part where x is greater than [latex]-3[/latex]. Place an open circle at [latex](-3,0)[/latex].
 Now place the line [latex]f(x) = x+3[/latex] on the graph starting at the point where [latex]x=-3[/latex]. Note that for this portion of the graph the point [latex](-3,0)[/latex] is included so you can remove the open circle.
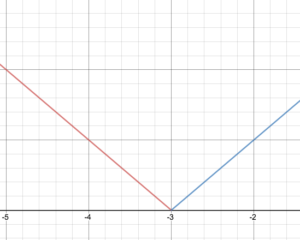 Notice the two pieces of the graph meet at the point [latex](-3,0)[/latex]. This will not be the case for all piecewise functions.
The domain of this function is all real numbers because [latex](-3,0)[/latex] is not included as the endpoint of [latex]f(x) = −x−3[/latex], but it is included as the endpoint for [latex]f(x) = x+3[/latex].
The range of this function starts at [latex]f(x)=0[/latex] and includes [latex]0[/latex], and goes to infinity, so we would write this as [latex]y\ge0[/latex].
Notice the two pieces of the graph meet at the point [latex](-3,0)[/latex]. This will not be the case for all piecewise functions.
The domain of this function is all real numbers because [latex](-3,0)[/latex] is not included as the endpoint of [latex]f(x) = −x−3[/latex], but it is included as the endpoint for [latex]f(x) = x+3[/latex].
The range of this function starts at [latex]f(x)=0[/latex] and includes [latex]0[/latex], and goes to infinity, so we would write this as [latex]y\ge0[/latex].
Example
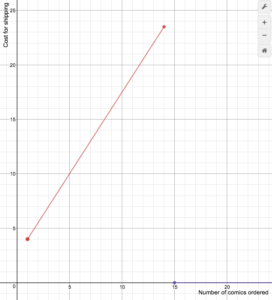
An on-line comic book retailer charges shipping costs of $2.50 plus an additional $1.50 for every comic book purchased for up to 14 books, but if 15 or more comic books are purchased then shipping is free. The following formula represents the cost of shipping, where n is the number of comic books: [latex-display]S(n)=\begin{cases}1.5n+2.5\text{ if }1\le{n}\le14\\0\text{ if }n\ge15\end{cases}[/latex-display] Draw a graph of the cost function.Answer:
First, draw the line [latex]S(n)=1.5n+2.5[/latex]. We can use transformations: this is a vertical stretch by a factor of [latex]1.5[/latex] and a vertical shift by [latex]2.5[/latex].
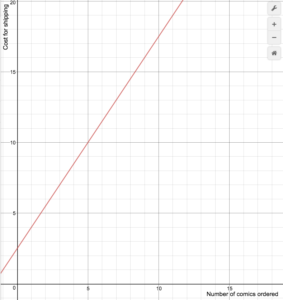 Now we can eliminate the portions of the graph that are not in the domain. This leaves us with the portion of the graph at [latex]1\le{n}\le14[/latex].
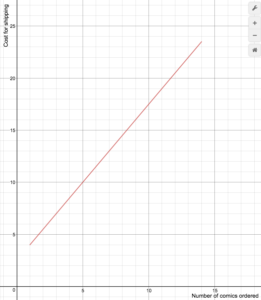 Last, add the constant function [latex]S(n)=0[/latex] for inputs greater than or equal to [latex]15[/latex]. Place closed dots on the ends of the graph to indicate the inclusion of the endpoints.
Summary
To graph piecewise functions, first identify where the domain is partitioned by boundary values. Graph functions on the domain using tools such as plotting points or transformations. Be sure to use open or closed circles on the endpoints of each domain based on whether the endpoint is included.Contribute!
Licenses & Attributions
CC licensed content, Original
- Revision and Adaptation. Provided by: Lumen Learning License: CC BY: Attribution.
CC licensed content, Shared previously
- College Algebra, Unit 1.4 Function Notation. Authored by: Carl Stitz and Jeff Zeager. Located at: https://www.stitz-zeager.com/szca07042013.pdf. License: CC BY: Attribution.
- Ex 2: Graph a Piecewise Defined Function. Authored by: James Sousa (Mathispower4u.com) . License: CC BY: Attribution.
CC licensed content, Specific attribution
- College Algebra. Provided by: OpenStax Authored by: Jay Abramson, et al.. Located at: https://openstax.org/books/precalculus/pages/1-introduction-to-functions. License: CC BY: Attribution. License terms: Download for free at: http://cnx.org/contents/[email protected].
