Plotting Points on the Coordinate Plane
Learning Outcomes
- Identify quadrants on the coordinate plane
- Plot points on a rectangular coordinate system
Introduction to the Coordinate Plane
You have likely used a coordinate plane before. For example, have you ever used a gridded overlay to map the position of an object or location? Many maps, such as the Campus Map shown below, use a grid system to identify locations. This map uses a horizontal and vertical grid to convey information about an object’s location. Do you see the numbers [latex]1,2,3[/latex], and [latex]4[/latex] across the top and bottom of the map and the letters A, B, C, and D along the sides? Every location on the map can be identified by a number and a letter. The general location of any item on this map can be found by using the letter and number of its grid square. For example, the Student Center is in section 2B. It is located in the grid section above the number [latex]2[/latex] and next to the letter B. In which grid section is the Stadium? The Stadium is in section 4D.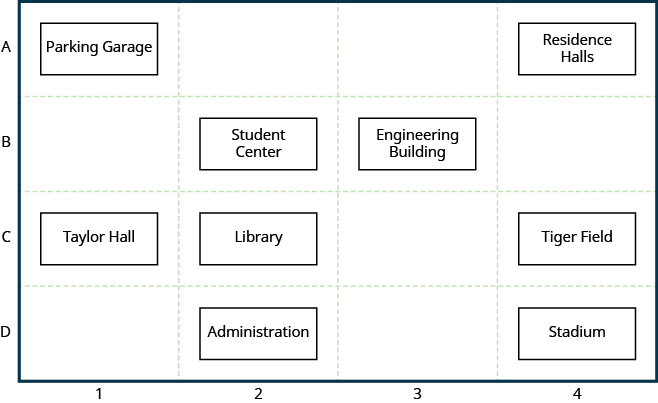
example
Use the map above.- Find the grid section of the Residence Halls.
- What is located in grid section 4C?
Answer: Solution
- Read the number below the Residence Halls, [latex]4[/latex], and the letter to the side, A. So the Residence Halls are in grid section 4A.
- Find [latex]4[/latex] across the bottom of the map and C along the side. Look below the [latex]4[/latex] and next to the C. Tiger Field is in grid section 4C.
Rectangular Coordinate System
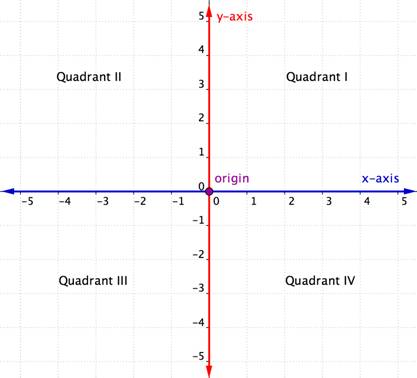
The coordinate plane has similar elements to the grid shown above. Look at the Rectangular Coordinate System show in the box below. It consists of a horizontal axis and a vertical axis, number lines that intersect at right angles. (They are perpendicular to each other.) The horizontal axis in the coordinate plane is called the [latex]x-axis[/latex]. The vertical axis is called the [latex]y-axis[/latex]. The point at which the two axes intersect is called the origin. The origin is at [latex]0[/latex] on the [latex]x-axis[/latex] and [latex]0[/latex] on the [latex]y-axis[/latex]. The intersecting x- and y-axes of the coordinate plane divide it into four sections. These four sections are called quadrants. Quadrants are named using the Roman numerals I, II, III, and IV beginning with the top right quadrant and moving counter clockwise.The rectangular coordinate system
Ordered Pair
An ordered pair, [latex]\left(x,y\right)[/latex] gives the coordinates of a point in a rectangular coordinate system. [latex-display]\begin{array}{c}\text{The first number is the }x\text{-coordinate}.\hfill \\ \text{The second number is the }y\text{-coordinate}.\hfill \end{array}[/latex-display]
Plotting Points in the Coordinate Plane
Now that you know the components of a rectangular system, let's learn how to plot ordered pairs, that is locate a point on the coordinate system given an ordered pair. Just remember, the process start at the origin—the beginning! Let’s try locating the point [latex]\left(2,5\right)[/latex]. In this ordered pair, the [latex]x[/latex]-coordinate is [latex]2[/latex] and the [latex]y[/latex]-coordinate is [latex]5[/latex] . We start by locating the [latex]x[/latex] value, [latex]2[/latex], on the [latex]x\text{-axis.}[/latex] Then we lightly sketch a vertical line through [latex]x=2[/latex], as shown in the image below.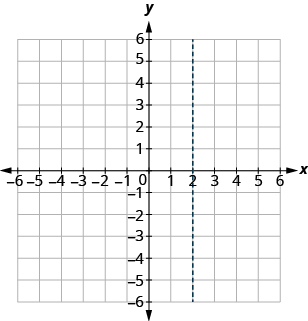 Now we locate the [latex]y[/latex] value, [latex]5[/latex], on the [latex]y[/latex] -axis and sketch a horizontal line through [latex]y=5[/latex] . The point where these two lines meet is the point with coordinates [latex]\left(2,5\right)[/latex]. We plot the point there, as shown in the image below.
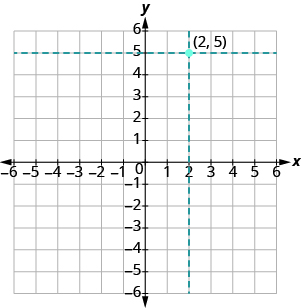 Reminder: Any ordered pair, such as (2,5), represents one single point on the graph.
example
Plot [latex]\left(1,3\right)[/latex] and [latex]\left(3,1\right)[/latex] in the same rectangular coordinate system.Answer:
Solution
The coordinate values are the same for both points, but the [latex]x[/latex] and [latex]y[/latex] values are reversed. Let’s begin with point [latex]\left(1,3\right)[/latex]. The [latex]x\text{-coordinate}[/latex] is [latex]1[/latex] so find [latex]1[/latex] on the [latex]x\text{-axis}[/latex] and sketch a vertical line through [latex]x=1[/latex]. The [latex]y\text{-coordinate}[/latex] is [latex]3[/latex] so we find [latex]3[/latex] on the [latex]y\text{-axis}[/latex] and sketch a horizontal line through [latex]y=3[/latex]. Where the two lines meet, we plot the point [latex]\left(1,3\right)[/latex].
 To plot the point [latex]\left(3,1\right)[/latex], we start by locating [latex]3[/latex] on the [latex]x\text{-axis}[/latex] and sketch a vertical line through [latex]x=3[/latex]. Then we find [latex]1[/latex] on the [latex]y\text{-axis}[/latex] and sketch a horizontal line through [latex]y=1[/latex]. Where the two lines meet, we plot the point [latex]\left(3,1\right)[/latex].
 Notice that the order of the coordinates does matter, so, [latex]\left(1,3\right)[/latex] is not the same point as [latex]\left(3,1\right)[/latex].
Example
Plot the point [latex](1, 3)[/latex].Answer: The x-coordinate is [latex]1[/latex] because it comes first in the ordered pair. Start at the origin and move a distance of [latex]1[/latex] unit in a positive direction (to the right) from the origin along the x-axis. The y-coordinate is [latex]3[/latex] because it comes second in the ordered pair. From here move directly [latex]3[/latex] units in a positive direction (up). If you look over to the y-axis, you should be lined up with [latex]3[/latex] on that axis.
Answer
Draw a point at this location and label the point [latex](1, 3)[/latex].
try it
[ohm_question]146882[/ohm_question]Example
Plot the point [latex](−4,−2)[/latex].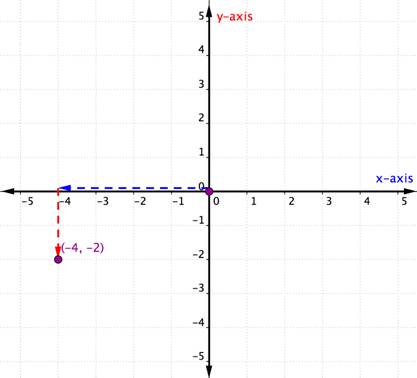 The x-coordinate is [latex]−4[/latex] because it comes first in the ordered pair. Start at the origin and move [latex]4[/latex] units in a negative direction (left) along the x-axis.
The y-coordinate is [latex]−2[/latex] because it comes second in the ordered pair. Now move [latex]2[/latex] units in a negative direction (down). If you look over to the y-axis, you should be lined up with [latex]−2[/latex] on that axis.
Now draw a point at that location and label it.
The x-coordinate is [latex]−4[/latex] because it comes first in the ordered pair. Start at the origin and move [latex]4[/latex] units in a negative direction (left) along the x-axis.
The y-coordinate is [latex]−2[/latex] because it comes second in the ordered pair. Now move [latex]2[/latex] units in a negative direction (down). If you look over to the y-axis, you should be lined up with [latex]−2[/latex] on that axis.
Now draw a point at that location and label it.
Steps for Plotting an Ordered Pair (x, y) in the Coordinate Plane
- Determine the x-coordinate. Beginning at the origin, move horizontally, the direction of the x-axis, the distance given by the x-coordinate. If the x-coordinate is positive, move to the right; if the x-coordinate is negative, move to the left.
- Determine the y-coordinate. Beginning at the x-coordinate, move vertically, the direction of the y-axis, the distance given by the y-coordinate. If the y-coordinate is positive, move up; if the y-coordinate is negative, move down.
- Draw a point at the ending location. Label the point with the ordered pair.
- An ordered pair is represented by a single point on the graph.
example
How do the signs affect the location of the points? Plot each point: 1. [latex]\left(-5,2\right)[/latex] 2. [latex]\left(-5,-2\right)[/latex] 3. [latex]\left(5,2\right)[/latex] 4. [latex]\left(5,-2\right)[/latex]Answer:
Solution
As we locate the [latex]x\text{-coordinate}[/latex] and the [latex]y\text{-coordinate}[/latex], we must be careful with the signs.

try it
[ohm_question]146885[/ohm_question]Watch the video below for more examples of how to plot ordered pairs.
https://youtu.be/p_MESleS3mwIdentify quadrants and use them to plot points
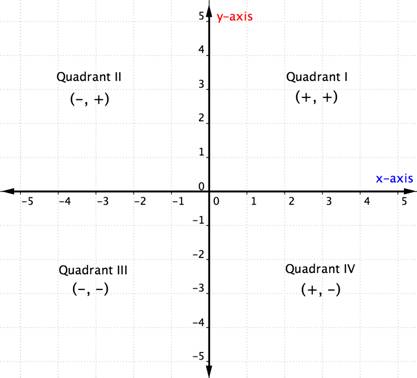
Recall that when we described the rectangular coordinate system above, we mentioned the four quadrants, quadrants I, II, III, and IV. These quadrants can be useful for locating points because ordered pairs within any particular quadrant share certain characteristics. Look at each quadrant in the graph below. What do you notice about the signs of the x- and y-coordinates of the points within each quadrant?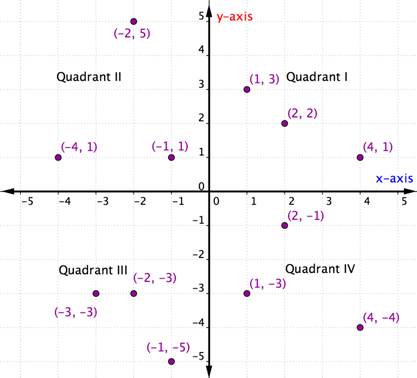 Within each quadrant, the signs of the x-coordinates and y-coordinates of each ordered pair are the same. They also follow a pattern, which is outlined in the table below.
| Quadrant | General Form of Point in this Quadrant | Example | Description |
|---|---|---|---|
| I | [latex](+,+)[/latex] | [latex](5,4)[/latex] | Starting from the origin, go along the x-axis in a positive direction (right) and along the y-axis in a positive direction (up). |
| II | [latex](−,+)[/latex] | [latex](−5,4)[/latex] | Starting from the origin, go along the x-axis in a negative direction (left) and along the y-axis in a positive direction (up). |
| III | [latex](−,−)[/latex] | [latex](−5,−4)[/latex] | Starting from the origin, go along the x-axis in a negative direction (left) and along the y-axis in a negative direction (down). |
| IV | [latex](+,−)[/latex] | [latex](5,−4)[/latex] | Starting from the origin, go along the x-axis in a positive direction (right) and along the y-axis in a negative direction (down). |
 The example below details how to determine the quadrant location of a point just by thinking about the signs of its coordinates. Thinking about the quadrant location before plotting a point can help you prevent a mistake. It is also useful knowledge for checking that you have plotted a point correctly.
Example
In which quadrant is the point [latex](−7,10)[/latex] located?Answer: Look at the signs of the x- and y-coordinates. For this ordered pair, the signs are [latex](−,+)[/latex].
[latex](−7,10)[/latex]
Using the table or grid above, locate the pattern [latex](−,+)[/latex]. Points with the pattern [latex](−,+)[/latex] are in Quadrant II.Answer
The point [latex](−7,10)[/latex] is in Quadrant II.Example
In which quadrant is the point [latex](−10,−5)[/latex] located?Answer: Look at the signs of the x- and y-coordinates. For this ordered pair, the signs are [latex](−,−)[/latex].
[latex](−10,−5)[/latex]
Points with the pattern [latex](−,−)[/latex] are in Quadrant III. Using the table or grid above, locate the pattern [latex](−,−)[/latex].Answer
The point [latex](−10,−5)[/latex] is in Quadrant III.Exercises
Plot each point in the rectangular coordinate system and identify the quadrant in which the point is located: 1. [latex]\left(-1,3\right)[/latex] 2. [latex]\left(-3,-4\right)[/latex] 3. [latex]\left(2,-3\right)[/latex] 4. [latex]\left(3,{\dfrac{5}{2}}\right)[/latex]Answer:
Solution
The first number of the coordinate pair is the [latex]x\text{-coordinate}[/latex], and the second number is the [latex]y\text{-coordinate}[/latex].
1. Since [latex]x=-1,y=3[/latex], the point [latex]\left(-1,3\right)[/latex] is in Quadrant II.
2. Since [latex]x=-3,y=-4[/latex], the point [latex]\left(-3,-4\right)[/latex] is in Quadrant III.
3. Since [latex]x=2,y=-1[/latex], the point [latex]\left(2,-1\right)[/latex] is in Quadrant lV.
4. Since [latex]x=3,y={\dfrac{5}{2}}[/latex], the point [latex]\left(3,{\dfrac{5}{2}}\right)[/latex] is in Quadrant I. It may be helpful to write [latex]{\dfrac{5}{2}}[/latex] as the mixed number, [latex]2{\dfrac{1}{2}}[/latex], or decimal, [latex]2.5[/latex]. Then we know that the point is halfway between [latex]2[/latex] and [latex]3[/latex] on the [latex]y\text{-axis}[/latex].

try it
[ohm_question]146883[/ohm_question]You can watch the video below to see more examples of how to identify the quadrant that a point is located in.
https://youtu.be/iTsJsPgcE4EPoints on the Axes
What happens if an ordered pair has an x- or y-coordinate of zero? The example below shows the graph of the ordered pair [latex](0,4)[/latex]. Notice how the point [latex]\left(0,4\right)[/latex] is located on the [latex]y[/latex]-axis.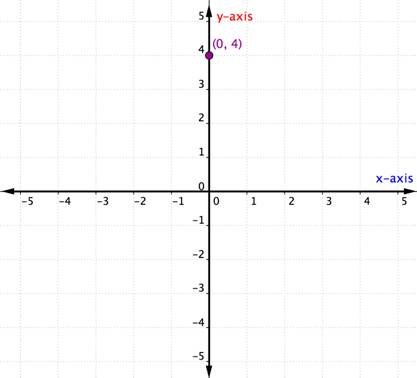 A point located on one of the axes is not considered to be in a quadrant. It is simply on one of the axes. Whenever the x-coordinate is [latex]0[/latex], the point is located on the y-axis. Similarly, any point that has a y-coordinate of [latex]0[/latex] will be located on the x-axis.
Points on the Axes
Points with a [latex]y\text{-coordinate}[/latex] equal to [latex]0[/latex] are on the [latex]x\text{-axis}[/latex], and have coordinates [latex]\left(a,0\right)[/latex]. Points with an [latex]x\text{-coordinate}[/latex] equal to [latex]0[/latex] are on the [latex]y\text{-axis}[/latex], and have coordinates [latex]\left(0,b\right)[/latex].The Origin
The point [latex]\left(0,0\right)[/latex] is called the origin. It is the point where the x-axis and y-axis intersect.ExAMPLE
Plot each point on a coordinate grid: 1. [latex]\left(0,5\right)[/latex] 2. [latex]\left(4,0\right)[/latex] 3. [latex]\left(-3,0\right)[/latex] 4. [latex]\left(0,0\right)[/latex] 5. [latex]\left(0,-1\right)[/latex]Answer: Solution
- Since [latex]x=0[/latex], the point whose coordinates are [latex]\left(0,5\right)[/latex] is on the [latex]y\text{-axis}[/latex].
- Since [latex]y=0[/latex], the point whose coordinates are [latex]\left(4,0\right)[/latex] is on the [latex]x\text{-axis}[/latex].
- Since [latex]y=0[/latex], the point whose coordinates are [latex]\left(-3,0\right)[/latex] is on the [latex]x\text{-axis}[/latex].
- Since [latex]x=0[/latex] and [latex]y=0[/latex], the point whose coordinates are [latex]\left(0,0\right)[/latex] is the origin.
- Since [latex]x=0[/latex], the point whose coordinates are [latex]\left(0,-1\right)[/latex] is on the [latex]y\text{-axis}[/latex].

TRY IT
[ohm_question]146886[/ohm_question]Contribute!
Licenses & Attributions
CC licensed content, Shared previously
- Determine the Ordered Pairs for Points Plotted on the Coordinate Plane. Authored by: mathispower4u. License: All Rights Reserved. License terms: Standard YouTube License.
- Plot Points Given as Ordered Pairs on the Coordinate Plane. Authored by: mathispower4u. License: All Rights Reserved. License terms: Standard YouTube License.
