Proportional Relationships and a Bit of Geometry
In the 2004 vice-presidential debates, Democratic contender John Edwards claimed that US forces have suffered "90% of the coalition casualties" in Iraq. Incumbent Vice President Dick Cheney disputed this, saying that in fact Iraqi security forces and coalition allies "have taken almost 50 percent" of the casualties.[footnote]http://www.factcheck.org/cheney_edwards_mangle_facts.html[/footnote] Who was correct? How can we make sense of these numbers? In this section, we will show how the idea of percent is used to describe parts of a whole. Percents are prevalent in the media we consume regularly, making it imperative that you understand what they mean and where they come from. We will also show you how to compare different quantities using proportions. Proportions can help us understand how things change or relate to each other.Learning Objectives
In this lesson you will learn how to do the following:- Given the part and the whole, write a percent
- Calculate both relative and absolute change of a quantity
- Calculate tax on a purchase
Percents
Percent literally means “per 100,” or “parts per hundred.” When we write 40%, this is equivalent to the fraction [latex]\displaystyle\frac{40}{100}[/latex] or the decimal 0.40. Notice that 80 out of 200 and 10 out of 25 are also 40%, since [latex]\displaystyle\frac{80}{200}=\frac{10}{25}=\frac{40}{100}[/latex]. A visual depiction of 40%
Percent
If we have a part that is some percent of a whole, then [latex]\displaystyle\text{percent}=\frac{\text{part}}{\text{whole}}[/latex], or equivalently, [latex]\text{part}\cdot\text{whole}=\text{percent}[/latex]. To do the calculations, we write the percent as a decimal. For a refresher on basic percentage rules, using the examples on this page, view the following video. https://youtu.be/Z229RysttR8Examples
In a survey, 243 out of 400 people state that they like dogs. What percent is this?Answer: [latex]\displaystyle\frac{243}{400}=0.6075=\frac{60.75}{100}[/latex] This is 60.75%. Notice that the percent can be found from the equivalent decimal by moving the decimal point two places to the right.
Example
Write each as a percent:- [latex]\displaystyle\frac{1}{4}[/latex]
- 0.02
- 2.35
Answer:
- [latex]\displaystyle\frac{1}{4}=0.25[/latex] = 25%
- 0.02 = 2%
- 2.35 = 235%
TRY IT NOW
Throughout this text, you will be given opportunities to answer questions and know immediately whether you answered correctly. To answer the question below, do the calculation on a separate piece of paper and enter your answer in the box. Click on the submit button , and if you are correct, a green box will appear around your answer. If you are incorrect, a red box will appear. You can click on "Try Another Version of This Question" as many times as you like. Practice all you want!Example
The value of a car dropped from $7400 to $6800 over the last year. What percent decrease is this?Answer: To compute the percent change, we first need to find the dollar value change: $6800 – $7400 = –$600. Often we will take the absolute value of this amount, which is called the absolute change: |–600| = 600. Since we are computing the decrease relative to the starting value, we compute this percent out of $7400: [latex]\displaystyle\frac{600}{7400}=0.081=[/latex] 8.1% decrease. This is called a relative change.
Absolute and Relative Change
Given two quantities, Absolute change =[latex]\displaystyle|\text{ending quantity}-\text{starting quantity}|[/latex] Relative change: [latex]\displaystyle\frac{\text{absolute change}}{\text{starting quantity}}[/latex]- Absolute change has the same units as the original quantity.
- Relative change gives a percent change.
Example
There are about 75 QFC supermarkets in the United States. Albertsons has about 215 stores. Compare the size of the two companies.Answer: When we make comparisons, we must ask first whether an absolute or relative comparison. The absolute difference is 215 – 75 = 140. From this, we could say “Albertsons has 140 more stores than QFC.” However, if you wrote this in an article or paper, that number does not mean much. The relative difference may be more meaningful. There are two different relative changes we could calculate, depending on which store we use as the base: Using QFC as the base, [latex]\displaystyle\frac{140}{75}=1.867[/latex]. This tells us Albertsons is 186.7% larger than QFC. Using Albertsons as the base,[latex]\displaystyle\frac{140}{215}=0.651[/latex]. This tells us QFC is 65.1% smaller than Albertsons. Notice both of these are showing percent differences. We could also calculate the size of Albertsons relative to QFC:[latex]\displaystyle\frac{215}{75}=2.867[/latex], which tells us Albertsons is 2.867 times the size of QFC. Likewise, we could calculate the size of QFC relative to Albertsons:[latex]\displaystyle\frac{75}{215}=0.349[/latex], which tells us that QFC is 34.9% of the size of Albertsons.
Example
Suppose a stock drops in value by 60% one week, then increases in value the next week by 75%. Is the value higher or lower than where it started?Answer: To answer this question, suppose the value started at $100. After one week, the value dropped by 60%: $100 – $100(0.60) = $100 – $60 = $40. In the next week, notice that base of the percent has changed to the new value, $40. Computing the 75% increase: $40 + $40(0.75) = $40 + $30 = $70. In the end, the stock is still $30 lower, or [latex]\displaystyle\frac{\$30}{100}[/latex] = 30% lower, valued than it started.
A video walk-through of this example can be seen here. https://youtu.be/4HNxwYMTNl8TRY IT NOW
Example
Suppose you’re tiling the floor of a 10 ft by 10 ft room, and find that 100 tiles will be needed. How many tiles will be needed to tile the floor of a 20 ft by 20 ft room?Answer: In this case, while the width the room has doubled, the area has quadrupled. Since the number of tiles needed corresponds with the area of the floor, not the width, 400 tiles will be needed. We could find this using a proportion based on the areas of the rooms: [latex-display]\displaystyle\frac{100\text{ tiles}}{100\text{ft}^2}=\frac{n\text{ tiles}}{400\text{ft}^2}[/latex-display]
Example
Suppose a small company spends $1000 on an advertising campaign, and gains 100 new customers from it. How many new customers should they expect if they spend $10,000?Answer: While it is tempting to say that they will gain 1000 new customers, it is likely that additional advertising will be less effective than the initial advertising. For example, if the company is a hot tub store, there are likely only a fixed number of people interested in buying a hot tub, so there might not even be 1000 people in the town who would be potential customers.
Matters of scale in this example and the previous one are explained in more detail here. https://youtu.be/-e2typcrhLEExamples
The 2010 U.S. military budget was $683.7 billion. To gain perspective on how much money this is, answer the following questions.- What would the salary of each of the 1.4 million Walmart employees in the US be if the military budget were distributed evenly amongst them?
- If you distributed the military budget of 2010 evenly amongst the 300 million people who live in the US, how much money would you give to each person?
- If you converted the US budget into $100 bills, how long would it take you to count it out - assume it takes one second to count one $100 bill.
Answer: Here we have a very large number, about $683,700,000,000 written out. Of course, imagining a billion dollars is very difficult, so it can help to compare it to other quantities.
- If that amount of money was used to pay the salaries of the 1.4 million Walmart employees in the U.S., each would earn over $488,000.
- There are about 300 million people in the U.S. The military budget is about $2,200 per person.
- If you were to put $683.7 billion in $100 bills, and count out 1 per second, it would take 216 years to finish counting it.
Example
Compare the electricity consumption per capita in China to the rate in Japan.Answer: To address this question, we will first need data. From the CIA[footnote]https://www.cia.gov/library/publications/the-world-factbook/rankorder/2042rank.html[/footnote] website we can find the electricity consumption in 2011 for China was 4,693,000,000,000 KWH (kilowatt-hours), or 4.693 trillion KWH, while the consumption for Japan was 859,700,000,000, or 859.7 billion KWH. To find the rate per capita (per person), we will also need the population of the two countries. From the World Bank,[footnote]http://data.worldbank.org/indicator/SP.POP.TOTL[/footnote] we can find the population of China is 1,344,130,000, or 1.344 billion, and the population of Japan is 127,817,277, or 127.8 million. Computing the consumption per capita for each country: China: [latex]\displaystyle\frac{4,693,000,000,000\text{KWH}}{1,344,130,000\text{ people}}[/latex] ≈ 3491.5 KWH per person Japan: [latex]\displaystyle\frac{859,700,000,000\text{KWH}}{127,817,277\text{ people}}[/latex] ≈ 6726 KWH per person While China uses more than 5 times the electricity of Japan overall, because the population of Japan is so much smaller, it turns out Japan uses almost twice the electricity per person compared to China.
Working with large numbers is examined in more detail in this video. https://youtu.be/rCLh8ZvSQr8A Bit of Geometry
Geometric shapes, as well as area and volumes, can often be important in problem solving. Let's start things off with an example, rather than trying to explain geometric concepts to you.
Example
Answer: There are several approaches we could take. We’ll use one based on triangles, which requires that it’s a sunny day. Suppose the tree is casting a shadow, say 15 ft long. I can then have a friend help me measure my own shadow. Suppose I am 6 ft tall, and cast a 1.5 ft shadow. Since the triangle formed by the tree and its shadow has the same angles as the triangle formed by me and my shadow, these triangles are called similar triangles and their sides will scale proportionally. In other words, the ratio of height to width will be the same in both triangles. Using this, we can find the height of the tree, which we’ll denote by h: [latex]\frac{6\text{ft. tall}}{1.5\text{ft. shadow}}=frac{h\text{ft. tall}}{15\text{ft. shadow}}
Similar Triangles
We introduced the idea of similar triangles in the previous example. One property of geometric shapes that we have learned is a helpful problem-solving tool is that of similarity. If two triangles are the same, meaning the angles between the sides are all the same, we can find an unknown length or height as in the last example. This idea of similarity holds for other geometric shapes as well.Guided Example
Mary was out in the yard one day and had her two daughters with her. She was doing some renovations and wanted to know how tall the house was. She noticed a shadow 3 feet long when her daughter was standing 12 feet from the house and used it to set up figure 1.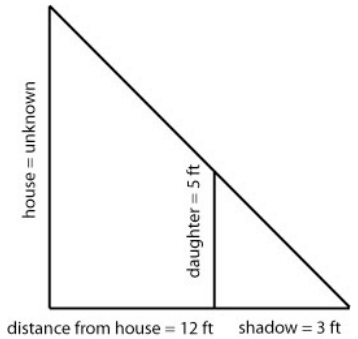 Figure 1.
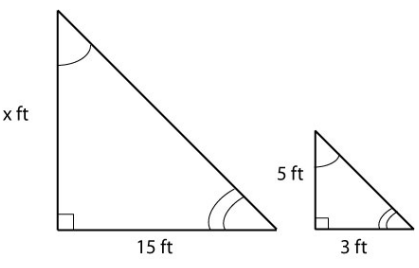 Figure 2.
TRY IT NOW
Licenses & Attributions
CC licensed content, Original
- Introduction: Proportional Relationships and a Bit of Geometry. Authored by: Lumen Learning. License: CC BY: Attribution.
CC licensed content, Shared previously
- Math in Society. Authored by: David Lippman. Located at: http://www.opentextbookstore.com/mathinsociety/. License: CC BY-SA: Attribution-ShareAlike.
- Caution sign. Authored by: JDDesign. License: CC0: No Rights Reserved.
- 40% shaded rectangle. Authored by: Clker-Free-Vector-Images. License: CC0: No Rights Reserved.
- Review of basic percents. Authored by: OCLPhase2's channel. License: CC BY: Attribution.
- Absolute and Relative Differences. Authored by: OCLPhase2's channel. License: CC BY: Attribution.
- Importance of base in percents. Authored by: OCLPhase2's channel. License: CC BY: Attribution.
- Combining percents. Authored by: OCLPhase2's channel. License: CC BY: Attribution.
- Evaluating claims involving percents. Authored by: OCLPhase2's channel. License: CC BY: Attribution.
- Percentage points and averaging percents. Authored by: OCLPhase2's channel. License: CC BY: Attribution.
- Question ID 17441, 17447, 17443. Authored by: Lippman, David. License: CC BY: Attribution. License terms: IMathAS Community License CC-BY + GPL.
- wind-364996_1280. Authored by: Stevebidmead. License: CC0: No Rights Reserved.
- Basic rates and proportions. Authored by: OCLPhase2's channel. License: CC BY: Attribution.
- Proportions using dimensional analysis. Authored by: OCLPhase2's channel. License: CC BY: Attribution.
- Proportions with unit conversion. Authored by: OCLPhase2's channel. License: CC BY: Attribution.
- Considering how/if things scale. Authored by: OCLPhase2's channel. License: CC BY: Attribution.
- Comparing quantities involving large numbers. Authored by: OCLPhase2's channel. License: CC BY: Attribution.
- Question ID 17454. Authored by: Lippman, David. License: CC BY: Attribution. License terms: IMathAS Community License CC-BY + GPL.
