Domain and Range
Learning Objectives
- Define the domain of functions from graphs
- One-to-one functions
- Use the horizontal line test to determine whether a function is one-to-one
- You can’t divide by 0.
- You can’t take the square (or other even) root of a negative number, as the result will not be a real number.
Find Domain and Range From a Graph
Finding domain and range of different functions is often a matter of asking yourself, what values can this function not have? Pictures make it easier to visualize what domain and range are, so we will show how to define the domain and range of functions given their graphs. What are the domain and range of the real-valued function [latex]f(x)=x+3[/latex]? This is a linear function. Remember that linear functions are lines that continue forever in each direction. Any real number can be substituted for x and get a meaningful output. For any real number, you can always find an x value that gives you that number for the output. Unless a linear function is a constant, such as [latex]f(x)=2[/latex], there is no restriction on the range.
The domain and range are all real numbers.
For the examples that follow, try to figure out the domain and range of the graphs before you look at the answer.
Any real number can be substituted for x and get a meaningful output. For any real number, you can always find an x value that gives you that number for the output. Unless a linear function is a constant, such as [latex]f(x)=2[/latex], there is no restriction on the range.
The domain and range are all real numbers.
For the examples that follow, try to figure out the domain and range of the graphs before you look at the answer.
Example
What are the domain and range of the real-valued function [latex]f(x)=−3x^{2}+6x+1[/latex]?
Answer: This is a quadratic function. There are no rational (divide by zero) or radical (negative number under a root) expressions, so there is nothing that will restrict the domain. Any real number can be used for x to get a meaningful output. Because the coefficient of [latex]x^{2}[/latex] is negative, it will open downward. With quadratic functions, remember that there is either a maximum (greatest) value, or a minimum (least) value. In this case, there is a maximum value. The vertex, or high point, is at (1, 4). From the graph, you can see that [latex]f(x)\leq4[/latex].
Answer
The domain is all real numbers, and the range is all real numbers f(x) such that [latex]f(x)\leq4[/latex]. You can check that the vertex is indeed at (1, 4). Since a quadratic function has two mirror image halves, the line of reflection has to be in the middle of two points with the same y value. The vertex must lie on the line of reflection, because it’s the only point that does not have a mirror image! In the previous example, notice that when [latex]x=2[/latex] and when [latex]x=0[/latex], the function value is 1. (You can verify this by evaluating f(2) and f(0).) That is, both (2, 1) and (0, 1) are on the graph. The line of reflection here is [latex]x=1[/latex], so the vertex must be at the point (1, f(1)). Evaluating f(1) gives [latex]f(1)=4[/latex], so the vertex is at (1, 4).Example
What is the domain and range of the real-valued function [latex]f(x)=-2+\sqrt{x+5}[/latex]?
Answer: This is a radical function. The domain of a radical function is any x value for which the radicand (the value under the radical sign) is not negative. That means [latex]x+5\geq0[/latex], so [latex]x\geq−5[/latex]. Since the square root must always be positive or 0, [latex] \displaystyle \sqrt{x+5}\ge 0[/latex]. That means [latex] \displaystyle -2+\sqrt{x+5}\ge -2[/latex].
Answer
The domain is all real numbers x where [latex]x\geq−5[/latex], and the range is all real numbers f(x) such that [latex]f(x)\geq−2[/latex].Example
What is the domain of the real-valued function [latex] \displaystyle f(x)=\frac{3x}{x+2}[/latex]?
Answer: This is a rational function. The domain of a rational function is restricted where the denominator is 0. In this case, [latex]x+2[/latex] is the denominator, and this is 0 only when [latex]x=−2[/latex].
Answer
The domain is all real numbers except [latex]−2[/latex]Example: Finding Domain and Range from a Graph
Find the domain and range of the function [latex]f[/latex].![Graph of a function from (-3, 1].](https://s3-us-west-2.amazonaws.com/courses-images/wp-content/uploads/sites/2862/2017/12/26165219/CNX_Precalc_Figure_01_02_0072.jpg)
Answer:
We can observe that the horizontal extent of the graph is –3 to 1, so the domain of [latex]f[/latex] is [latex]\left(-3,1\right][/latex].
 The vertical extent of the graph is 0 to [latex]–4[/latex], so the range is [latex]\left[-4,0\right)[/latex].
Try It
[ohm_question]2316[/ohm_question]Example: Finding Domain and Range from a Graph of Oil Production
Find the domain and range of the function [latex]f[/latex].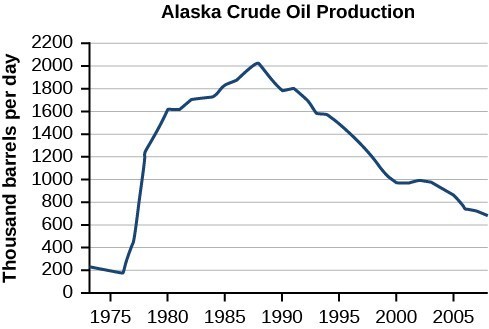 (credit: modification of work by the U.S. Energy Information Administration)
Answer: The input quantity along the horizontal axis is "years," which we represent with the variable [latex]t[/latex] for time. The output quantity is "thousands of barrels of oil per day," which we represent with the variable [latex]b[/latex] for barrels. The graph may continue to the left and right beyond what is viewed, but based on the portion of the graph that is visible, we can determine the domain as [latex]1973\le t\le 2008[/latex] and the range as approximately [latex]180\le b\le 2010[/latex]. In interval notation, the domain is [1973, 2008], and the range is about [180, 2010]. For the domain and the range, we approximate the smallest and largest values since they do not fall exactly on the grid lines.
Try It
Given the graph, identify the domain and range using interval notation.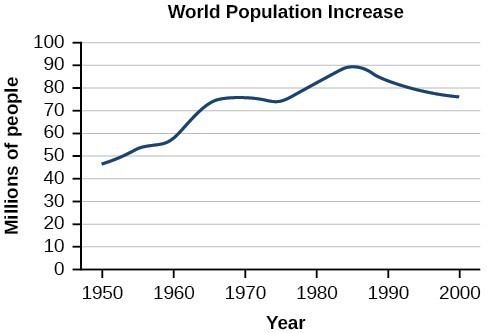
Answer: Domain = [1950, 2002] Range = [47,000,000, 89,000,000]
Identify a One-to-One Function
Remember that in a function, the input value must have one and only one value for the output. There is a name for the set of input values and another name for the set of output values for a function. The set of input values is called the domain of the function. And the set of output values is called the range of the function. In the first example we remind you how to define domain and range using a table of values.Example
Find the domain and range for the function.|
x |
y |
|---|---|
|
−5 |
−6 |
|
−2 |
−1 |
|
−1 |
0 |
|
0 |
3 |
|
5 |
15 |
Answer: The domain is the set of inputs or x-coordinates.
[latex]\{−5,−2,−1,0,5\}[/latex]
The range is the set of outputs of y-coordinates.[latex]\{−6,−1,0,3,15\}[/latex]
Answer
[latex-display]\begin{array}{l}\text{Domain}:\{−5,−2,−1,0,5\}\\\text{Range}:\{−6,−1,0,3,15\}\end{array}\\[/latex-display]
However, some functions have only one input value for each output value, as well as having only one output for each input. We call these functions one-to-one functions. As an example, consider a school that uses only letter grades and decimal equivalents, as listed in.
| Letter grade | Grade point average |
|---|---|
| A | 4.0 |
| B | 3.0 |
| C | 2.0 |
| D | 1.0 |
This grading system represents a one-to-one function, because each letter input yields one particular grade point average output and each grade point average corresponds to one input letter.
To visualize this concept, let’s look again at the two simple functions sketched in (a)and (b) of Figure 10.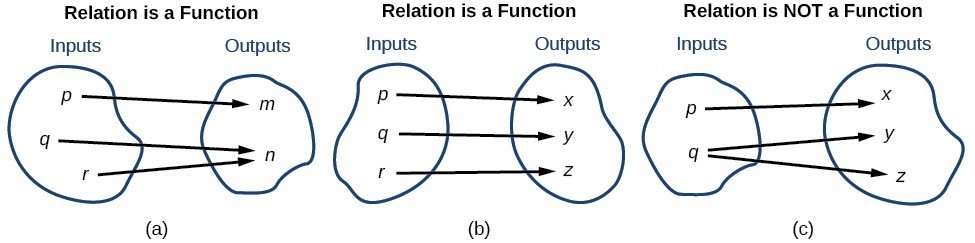 Figure 10
A General Note: One-to-One Function
A one-to-one function is a function in which each output value corresponds to exactly one input value.Example
Which table represents a one-to-one function? a)| input | output |
| 1 | 5 |
| 12 | 2 |
| 0 | -1 |
| 4 | 2 |
| -5 | 0 |
| input | output |
| 4 | 8 |
| 8 | 16 |
| 16 | 32 |
| 32 | 64 |
| 64 | 128 |
Answer: Table a) maps the output value 2 to two different input values, therefore this is NOT a one-to-one function. Table b) maps each output to one unique input, therefore this IS a one-to-one function.
Answer
Table b) is one-to-oneUsing the Horizontal Line Test
An easy way to determine whether a function is a one-to-one function is to use the horizontal line test on the graph of the function. To do this, draw horizontal lines through the graph. If any horizontal line intersects the graph more than once, then the graph does not represent a one-to-one function.
How To: Given a graph of a function, use the horizontal line test to determine if the graph represents a one-to-one function.
- Inspect the graph to see if any horizontal line drawn would intersect the curve more than once.
- If there is any such line, determine that the function is not one-to-one.
Exercises
For the following graphs, determine which represent one-to-one functions.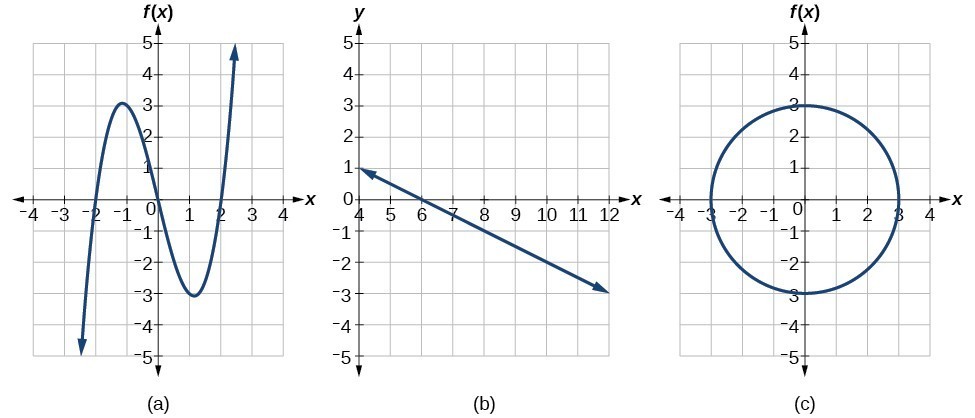
Answer:
The function in (a) is not one-to-one. Using the horizontal line test, as shown below, it intersects the graph of the function at two points (and we can even find horizontal lines that intersect it at three points.)

 The function (c) is not one-to-one, and is in fact not a function.

Summary
In real life and in algebra, different variables are often linked. When a change in value of one variable causes a change in the value of another variable, their interaction is called a relation. A relation has an input value which corresponds to an output value. When each input value has one and only one output value, that relation is a function. Functions can be written as ordered pairs, tables, or graphs. The set of input values is called the domain, and the set of output values is called the range.Licenses & Attributions
CC licensed content, Original
- Revision and Adaptation. Provided by: Lumen Learning License: CC BY: Attribution.
CC licensed content, Shared previously
- College Algebra. Provided by: OpenStax Located at: https://openstax.org/books/precalculus/pages/1-introduction-to-functions. License: CC BY: Attribution. License terms: Download for Free at: http://cnx.org/contents/[email protected].
- Unit 17: Functions, from Developmental Math: An Open Program. Provided by: Monterey Institute of Technology and Education Located at: https://www.nroc.org/. License: CC BY: Attribution.
- Ex 1: Determine the Domain and Range of the Graph of a Function. Authored by: James Sousa (Mathispower4u.com) for Lumen Learning. License: CC BY: Attribution.
- Determine if a Relation Given as a Table is a One-to-One Function. Authored by: James Sousa (Mathispower4u.com) for Lumen Learning. License: CC BY: Attribution.
- Question ID#2316. Authored by: Lippman,David. License: CC BY: Attribution.
