Learning Outcomes
By the end of this lesson, you will be able to:
- Determine the domain and range of a logarithmic function.
- Determine the x-intercept and vertical asymptote of a logarithmic function.
- Identify whether a logarithmic function is increasing or decreasing and give the interval.
- Identify the features of a logarithmic function that make it an inverse of an exponential function.
- Graph horizontal and vertical shifts of logarithmic functions.
- Graph stretches and compressions of logarithmic functions.
- Graph reflections of logarithmic functions.
Previously, we saw how creating a graphical representation of an exponential model gives us another layer of insight for predicting future events. How do logarithmic graphs give us insight into situations? Because every logarithmic function is the inverse function of an exponential function, we can think of every output on a logarithmic graph as the input for the corresponding inverse exponential equation. In other words, logarithms give the 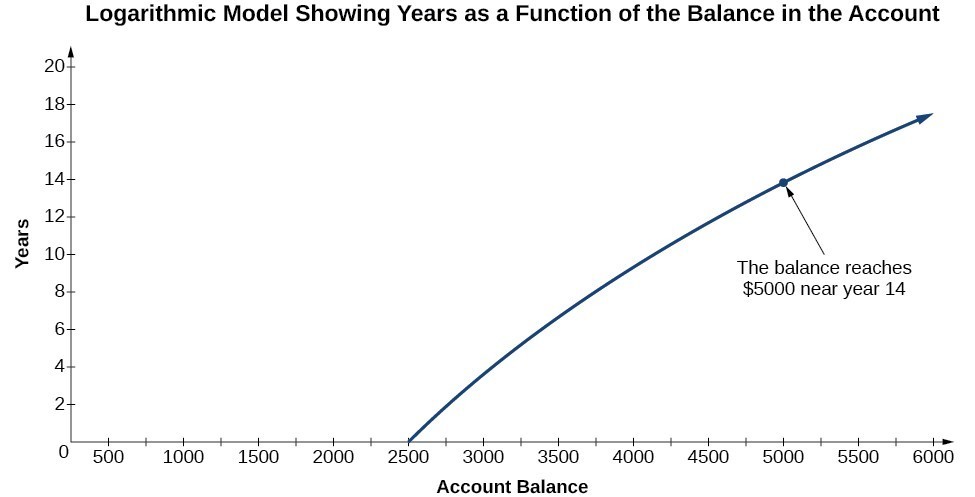 In this section we will discuss the values for which a logarithmic function is defined and then turn our attention to graphing the family of logarithmic functions.