Why It Matters: Algebraic Operations On Functions
 Why Study Algebraic Operations on Functions?
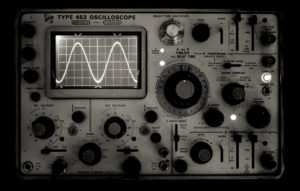
If you could “see” the sound coming from your speakers or earphones, it might resemble a series of ups and downs corresponding to the vibrations caused by the sound as it travels through the air. In fact, with the help of a tool called an oscilloscope, it is possible to visualize sounds as waves (technically, sound travels through air as a series of compression waves, however the oscilloscope converts sound to transverse waves for better visualization).
The wave itself may be regarded as the graph of a function. In other words, the sound wave may be modeled by the rule
[latex]y=f\left(x\right)[/latex]
It is not essential to understand exactly how this function is put together - you might learn more about the details of sound waves after studying a little trigonometry - however we can use what we learn in this module to transform the wave in certain ways.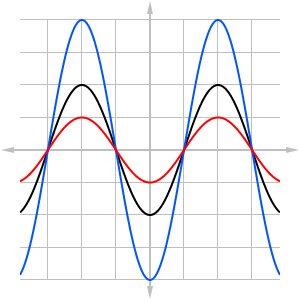 Figure 1
[latex]y=a\cdot f\left(x\right)[/latex]
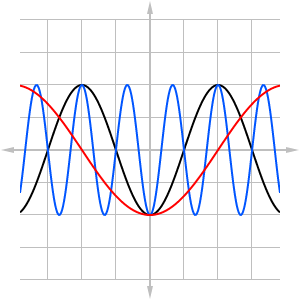 Figure 2
[latex]y=f\left(b\cdot x\right)[/latex]
In this module, you will learn all about these kinds of transformations along with other ways of changing and combining functions.Learning Objectives
Compositions of Functions- Combine functions using algebraic operations
- Create a new function by composition of functions
- Evaluate composite functions
- Find the domain of a composite function
- Decompose a composite function into its component functions
Transformations of Functions
- Graph functions using vertical and horizontal shifts
- Graph functions using reflections about the x-axis and the y-axis
- Determine whether a function is even, odd, or neither from its graph
- Graph functions using compressions and stretches
- Combine transformations
Inverse Functions
- Verify inverse functions
- Determine the domain and range of an inverse function, and restrict the domain of a function to make it one-to-one
- Find or evaluate the inverse of a function
- Use the graph of a one-to-one function to graph its inverse function on the same axes
Licenses & Attributions
CC licensed content, Original
- Why It Matters: Algebraic Operations on Functions. Authored by: Lumen Learning. License: CC BY: Attribution.
- 3 sinusoidal waves (Figure 1). Authored by: Shaun Ault for Lumen. License: CC BY: Attribution.
- 3 sinusoidal waves (Figure 2). Authored by: Shaun Ault for Lumen. License: CC BY: Attribution.
CC licensed content, Shared previously
- Tektronix Oscilloscope. Authored by: stanhua. Located at: https://www.flickr.com/photos/stanhua/149924240. License: CC BY: Attribution.
