Why It Matters
Use the concept of instantaneous rate of change of a function from graphical and algebraic points of view to describe and make decisions about situations in accounting, business, and economics
Introduction
Let’s say you have an advertising campaign going on a non-disposable item you are selling. You are collecting data and notice that your sales (in millions) are based on the total amount you have invested in advertising (in thousands). The graph below reflects this.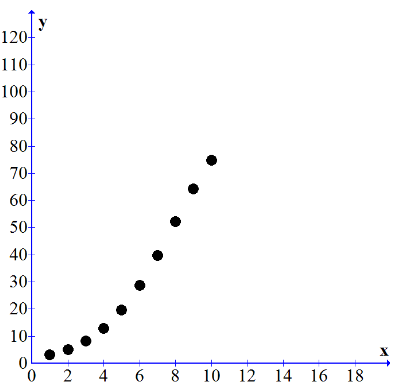 Question 1: If I invest $2000 in advertising what would be the rate of return on sales (i.e. how much would sales increase or decrease based on my investment in advertising)?
Question 2: Is there a time when I should decrease the amount of money I am spending on advertising?
Question 1: If I invest $2000 in advertising what would be the rate of return on sales (i.e. how much would sales increase or decrease based on my investment in advertising)?
Question 2: Is there a time when I should decrease the amount of money I am spending on advertising?
Learning Outcomes
- Interpret the derivative as an instantaneous rate of change
- Find and classify relative extrema, and find and classify absolute extrema of a function on a closed interval.
- Use the first derivative to determine intervals on which the graph of a function is increasing or decreasing and to determine critical points of the function.
- Use the second derivative to determine if a critical point is a max or min
- Use the second derivative to determine intervals on which the graph of a function is concave upwards or concave downwards and to determine points of inflection.
Licenses & Attributions
CC licensed content, Original
- Authored by: Paul Jones. License: CC BY: Attribution.
