Solutions for Polar Coordinates: Graphs
Solutions to Try Its
1. The equation fails the symmetry test with respect to the line [latex]\theta =\frac{\pi }{2}[/latex] and with respect to the pole. It passes the polar axis symmetry test. 2. Tests will reveal symmetry about the polar axis. The zero is [latex]\left(0,\frac{\pi }{2}\right)[/latex], and the maximum value is [latex]\left(3,0\right)[/latex]. 3.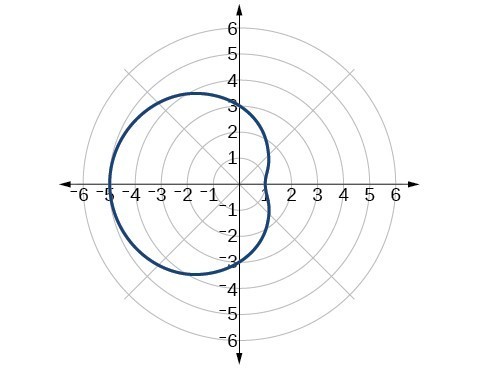 4. The graph is a rose curve, [latex]n[/latex] even
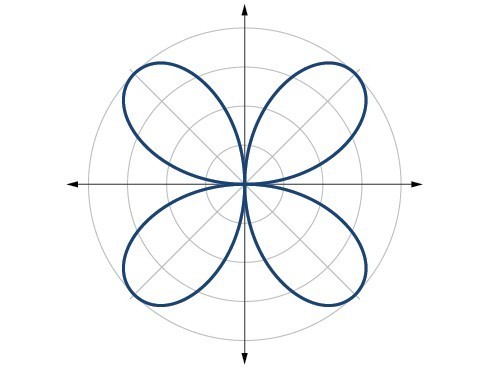 5. Rose curve, [latex]n[/latex] odd
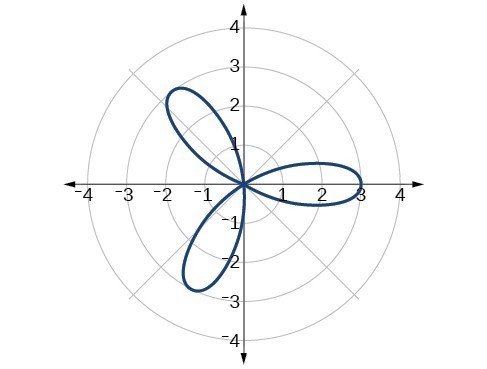 6.
6.
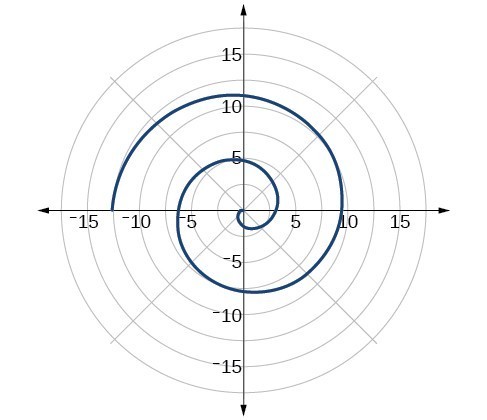
Solutions to Odd-Numbered Exercises
1. Symmetry with respect to the polar axis is similar to symmetry about the [latex]x[/latex] -axis, symmetry with respect to the pole is similar to symmetry about the origin, and symmetric with respect to the line [latex]\theta =\frac{\pi }{2}[/latex] is similar to symmetry about the [latex]y[/latex] -axis. 3. Test for symmetry; find zeros, intercepts, and maxima; make a table of values. Decide the general type of graph, cardioid, limaçon, lemniscate, etc., then plot points at [latex]\theta =0,\frac{\pi }{2},\pi \text{and }\frac{3\pi }{2}[/latex], and sketch the graph. 5. The shape of the polar graph is determined by whether or not it includes a sine, a cosine, and constants in the equation. 7. symmetric with respect to the polar axis 9. symmetric with respect to the polar axis, symmetric with respect to the line [latex]\theta =\frac{\pi }{2}[/latex], symmetric with respect to the pole 11. no symmetry 13. no symmetry 15. symmetric with respect to the pole 17. circle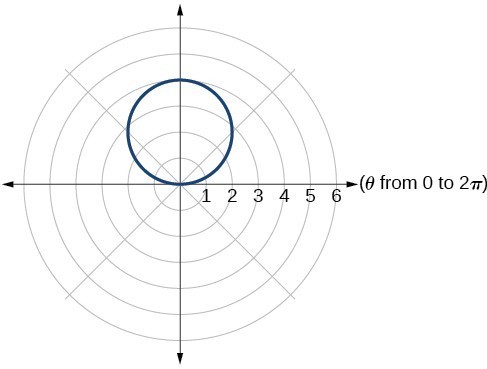 19. cardioid
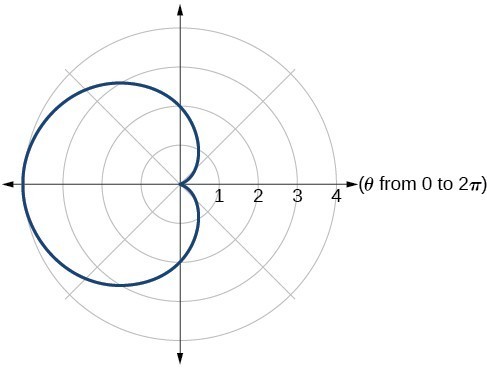 21. cardioid
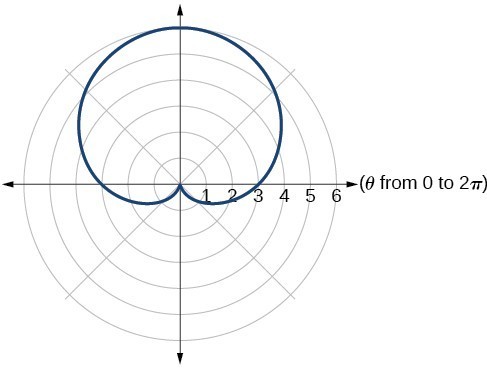 23. one-loop/dimpled limaçon
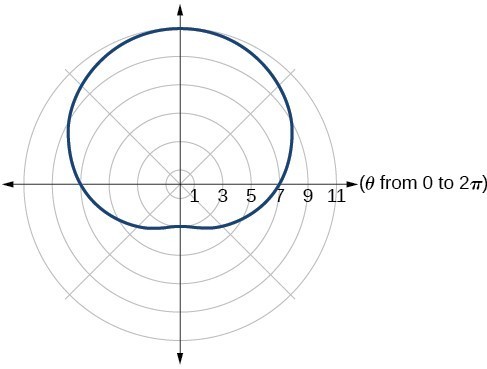 25. one-loop/dimpled limaçon
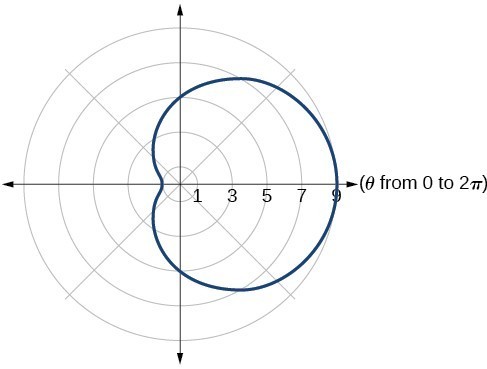 27. inner loop/two-loop limaçon
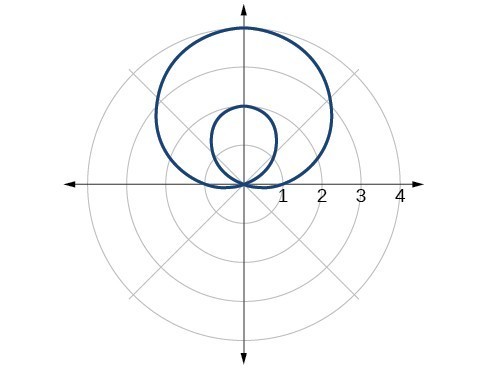 29. inner loop/two-loop limaçon
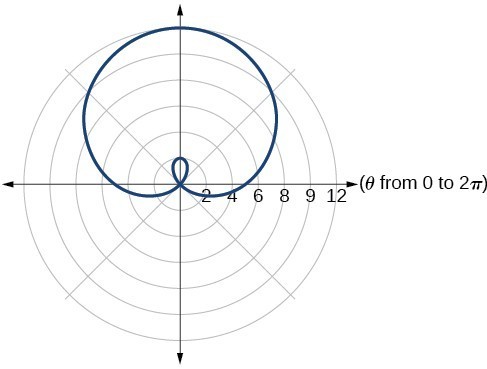 31. inner loop/two-loop limaçon
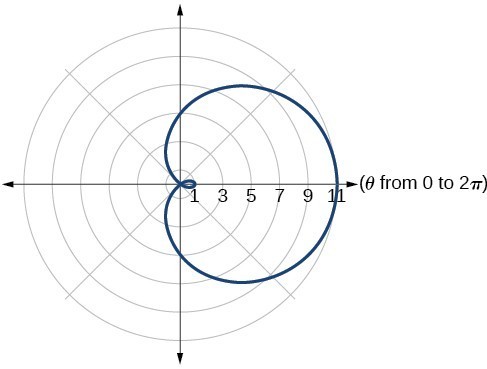 33. lemniscate
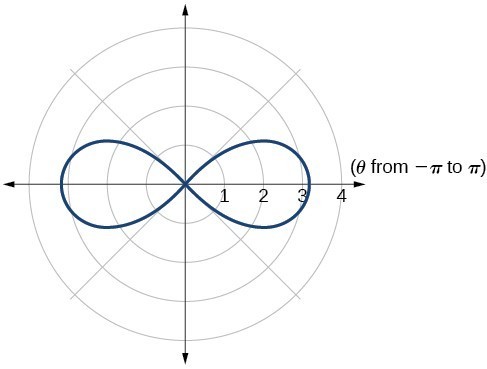 35. lemniscate
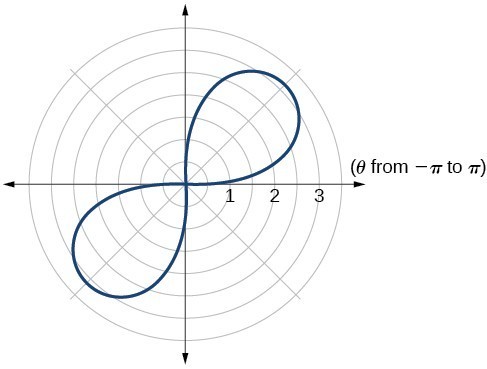 37. rose curve
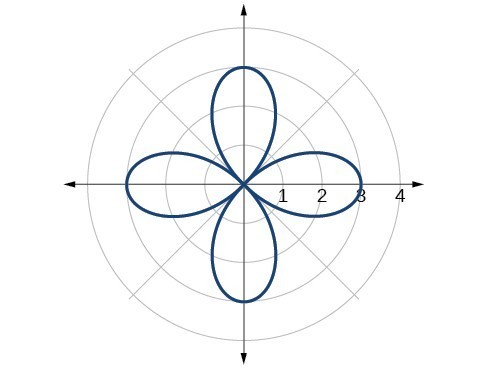 39. rose curve
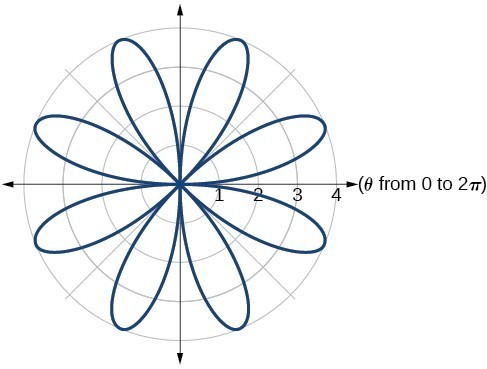 41. Archimedes’ spiral
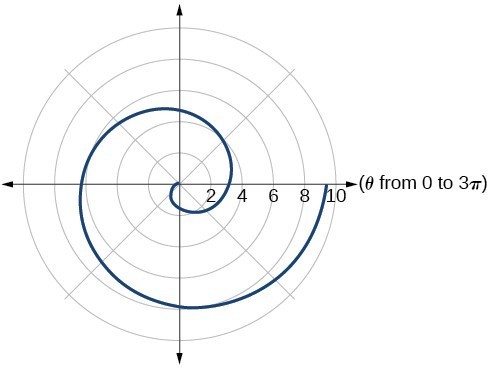 43. Archimedes’ spiral
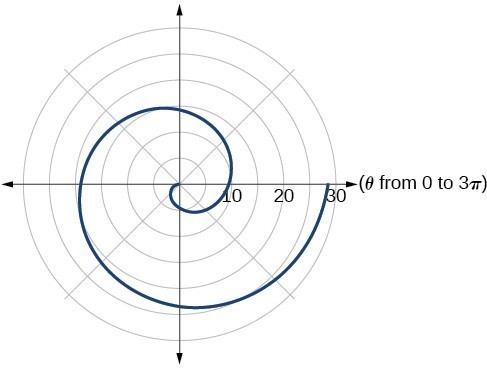 45.
45.
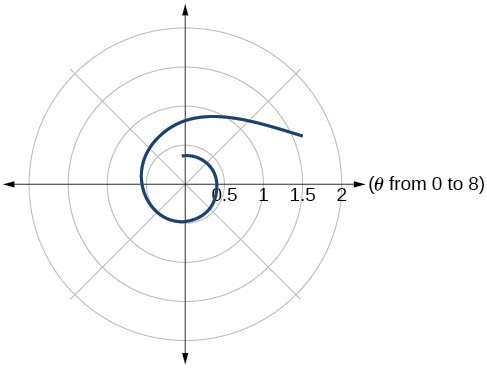 47.
47.
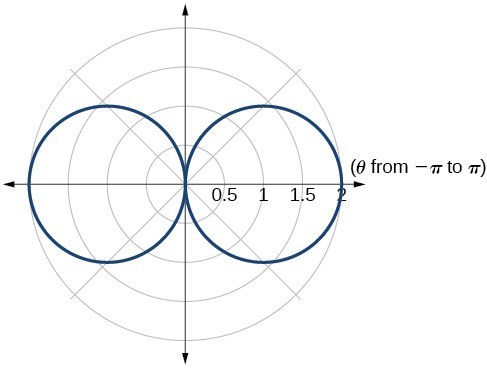 49.
49.
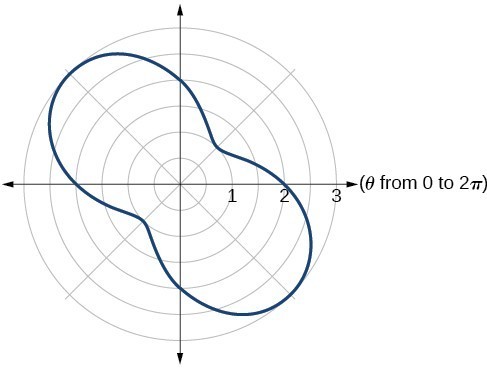 51.
51.
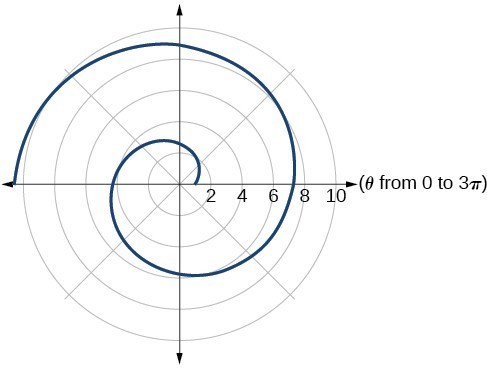 53.
53.
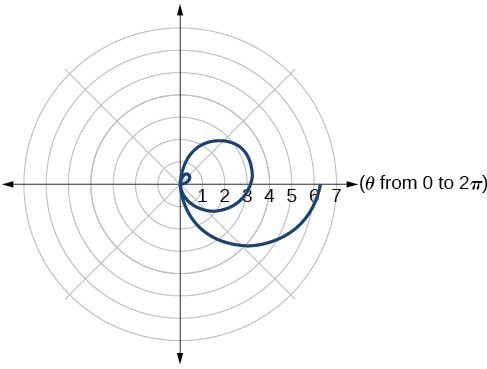 55. They are both spirals, but not quite the same.
57. Both graphs are curves with 2 loops. The equation with a coefficient of [latex]\theta [/latex] has two loops on the left, the equation with a coefficient of 2 has two loops side by side. Graph these from 0 to [latex]4\pi [/latex] to get a better picture.
59. When the width of the domain is increased, more petals of the flower are visible.
61. The graphs are three-petal, rose curves. The larger the coefficient, the greater the curve’s distance from the pole.
63. The graphs are spirals. The smaller the coefficient, the tighter the spiral.
65. [latex]\left(4,\frac{\pi }{3}\right),\left(4,\frac{5\pi }{3}\right)[/latex]
67. [latex]\left(\frac{3}{2},\frac{\pi }{3}\right),\left(\frac{3}{2},\frac{5\pi }{3}\right)[/latex]
69. [latex]\left(0,\frac{\pi }{2}\right),\left(0,\pi \right),\left(0,\frac{3\pi }{2}\right),\left(0,2\pi \right)[/latex]
71. [latex]\left(\frac{\sqrt[4]{8}}{2},\frac{\pi }{4}\right),\left(\frac{\sqrt[4]{8}}{2},\frac{5\pi }{4}\right)[/latex]
and at [latex]\theta =\frac{3\pi }{4},\frac{7\pi }{4}[/latex] since [latex]r[/latex] is squared
55. They are both spirals, but not quite the same.
57. Both graphs are curves with 2 loops. The equation with a coefficient of [latex]\theta [/latex] has two loops on the left, the equation with a coefficient of 2 has two loops side by side. Graph these from 0 to [latex]4\pi [/latex] to get a better picture.
59. When the width of the domain is increased, more petals of the flower are visible.
61. The graphs are three-petal, rose curves. The larger the coefficient, the greater the curve’s distance from the pole.
63. The graphs are spirals. The smaller the coefficient, the tighter the spiral.
65. [latex]\left(4,\frac{\pi }{3}\right),\left(4,\frac{5\pi }{3}\right)[/latex]
67. [latex]\left(\frac{3}{2},\frac{\pi }{3}\right),\left(\frac{3}{2},\frac{5\pi }{3}\right)[/latex]
69. [latex]\left(0,\frac{\pi }{2}\right),\left(0,\pi \right),\left(0,\frac{3\pi }{2}\right),\left(0,2\pi \right)[/latex]
71. [latex]\left(\frac{\sqrt[4]{8}}{2},\frac{\pi }{4}\right),\left(\frac{\sqrt[4]{8}}{2},\frac{5\pi }{4}\right)[/latex]
and at [latex]\theta =\frac{3\pi }{4},\frac{7\pi }{4}[/latex] since [latex]r[/latex] is squaredLicenses & Attributions
CC licensed content, Specific attribution
- Precalculus. Provided by: OpenStax Authored by: OpenStax College. Located at: https://cnx.org/contents/[email protected]:1/Preface. License: CC BY: Attribution.
