Finding Slope Given Two Points on a Line
Learning Outcomes
- Find the slope of a line given two points on the line
Sometimes we need to find the slope of a line between two points and we might not have a graph to count out the rise and the run. We could plot the points on grid paper, then count out the rise and the run, but there is a way to find the slope without graphing.
Before we get to it, we need to introduce some new algebraic notation. We have seen that an ordered pair [latex]\left(x,y\right)[/latex] gives the coordinates of a point. But when we work with slopes, we use two points. How can the same symbol [latex]\left(x,y\right)[/latex] be used to represent two different points?
Mathematicians use subscripts to distinguish between the points. A subscript is a small number written to the right of, and a little lower than, a variable.
- [latex]\left({x}_{1},{y}_{1}\right)\text{ read }x\text{ sub }1,y\text{ sub }1[/latex]
- [latex]\left({x}_{2},{y}_{2}\right)\text{ read }x\text{ sub }2,y\text{ sub }2[/latex]
 Since we have two points, we will use subscript notation.
[latex-display]\stackrel{{x}_{1},{y}_{1}}{\left(2,3\right)}\stackrel{{x}_{2},{y}_{2}}{\left(7,6\right)}[/latex-display]
On the graph, we counted the rise of [latex]3[/latex]. The rise can also be found by subtracting the [latex]y\text{-coordinates}[/latex] of the points.
[latex-display]\begin{array}{c}{y}_{2}-{y}_{1}\\ 6 - 3\\ 3\end{array}[/latex-display]
We counted a run of [latex]5[/latex]. The run can also be found by subtracting the [latex]x\text{-coordinates}[/latex].
[latex-display]\begin{array}{c}{x}_{2}-{x}_{1}\\ 7 - 2\\ 5\end{array}[/latex-display]
| We know | [latex]m=\frac{\text{rise}}{\text{run}}[/latex] |
| So | [latex]m=\frac{3}{5}[/latex] |
| We rewrite the rise and run by putting in the coordinates. | [latex]m=\frac{6 - 3}{7 - 2}[/latex] |
| But [latex]6[/latex] is the [latex]y[/latex] -coordinate of the second point, [latex]{y}_{2}[/latex] and [latex]3[/latex] is the [latex]y[/latex] -coordinate of the first point [latex]{y}_{1}[/latex] . So we can rewrite the rise using subscript notation. | [latex]m=\frac{{y}_{2}-{y}_{1}}{7 - 2}[/latex] |
| Also [latex]7[/latex] is the [latex]x[/latex] -coordinate of the second point, [latex]{x}_{2}[/latex] and [latex]2[/latex] is the [latex]x[/latex] -coordinate of the first point [latex]{x}_{2}[/latex] . So we rewrite the run using subscript notation. | [latex]m=\frac{{y}_{2}-{y}_{1}}{{x}_{2}-{x}_{1}}[/latex] |
Slope Formula
The slope of the line between two points [latex]\left({x}_{1},{y}_{1}\right)[/latex] and [latex]\left({x}_{2},{y}_{2}\right)[/latex] is [latex-display]m=\frac{{y}_{2}-{y}_{1}}{{x}_{2}-{x}_{1}}[/latex-display] Say the formula to yourself to help you remember it: [latex-display]\text{Slope is }y\text{ of the second point minus }y\text{ of the first point}[/latex-display] [latex-display]\text{over}[/latex-display] [latex-display]x\text{ of the second point minus }x\text{ of the first point.}[/latex-display]example
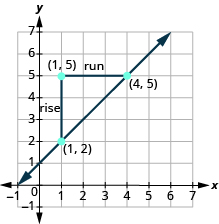
Find the slope of the line between the points [latex]\left(1,2\right)[/latex] and [latex]\left(4,5\right)[/latex]. Solution| We’ll call [latex]\left(1,2\right)[/latex] point #1 and [latex]\left(4,5\right)[/latex] point #2. | [latex]\stackrel{{x}_{1},{y}_{1}}{\left(1,2\right)}\text{and}\stackrel{{x}_{2},{y}_{2}}{\left(4,5\right)}[/latex] |
| Use the slope formula. | [latex]m=\frac{{y}_{2}-{y}_{1}}{{x}_{2}-{x}_{1}}[/latex] |
| Substitute the values in the slope formula: | |
| [latex]y[/latex] of the second point minus [latex]y[/latex] of the first point | [latex]m=\frac{5 - 2}{{x}_{2}-{x}_{1}}[/latex] |
| [latex]x[/latex] of the second point minus [latex]x[/latex] of the first point | [latex]m=\frac{5 - 2}{4 - 1}[/latex] |
| Simplify the numerator and the denominator. | [latex]m=\frac{3}{3}[/latex] |
| [latex]m=1[/latex] |
 The rise is [latex]3[/latex] and the run is [latex]3[/latex], so
[latex-display]\begin{array}{}\\ m=\frac{\text{rise}}{\text{run}}\hfill \\ m=\frac{3}{3}\hfill \\ m=1\hfill \end{array}[/latex-display]
try it
[ohm_question]147021[/ohm_question]| We’ll call [latex]\left(4,5\right)[/latex] point #1 and [latex]\left(1,2\right)[/latex] point #2. | [latex]\stackrel{{x}_{1},{y}_{1}}{\left(4,5\right)}\text{and}\stackrel{{x}_{2},{y}_{2}}{\left(1,2\right)}[/latex] |
| Use the slope formula. | [latex]m=\frac{{y}_{2}-{y}_{1}}{{x}_{2}-{x}_{1}}[/latex] |
| Substitute the values in the slope formula: | |
| [latex]y[/latex] of the second point minus [latex]y[/latex] of the first point | [latex]m=\frac{2 - 5}{{x}_{2}-{x}_{1}}[/latex] |
| [latex]x[/latex] of the second point minus [latex]x[/latex] of the first point | [latex]m=\frac{2 - 5}{1 - 4}[/latex] |
| Simplify the numerator and the denominator. | [latex]m=\frac{-3}{-3}[/latex] |
| [latex]m=1[/latex] |
example
Find the slope of the line through the points [latex]\left(-2,-3\right)[/latex] and [latex]\left(-7,4\right)[/latex].Answer: Solution
| We’ll call [latex]\left(-2,-3\right)[/latex] point #1 and [latex]\left(-7,4\right)[/latex] point #2. | [latex]\stackrel{{x}_{1},{y}_{1}}{\left(-2,-3\right)}\text{and}\stackrel{{x}_{2},{y}_{2}}{\left(-7,4\right)}[/latex] |
| Use the slope formula. | [latex]m=\frac{{y}_{2}-{y}_{1}}{{x}_{2}-{x}_{1}}[/latex] |
| Substitute the values | |
| [latex]y[/latex] of the second point minus [latex]y[/latex] of the first point | [latex]m=\frac{4-\left(-3\right)}{{x}_{2}-{x}_{1}}[/latex] |
| [latex]x[/latex] of the second point minus [latex]x[/latex] of the first point | [latex]m=\frac{4-\left(-3\right)}{-7-\left(-2\right)}[/latex] |
| Simplify. | [latex]m=\frac{7}{-5}[/latex] |
| [latex]m=-\frac{7}{5}[/latex] |
 [latex-display]\begin{array}{}\\ \\ \\ m=\frac{\text{rise}}{\text{run}}\\ m=\frac{-7}{5}\\ m=-\frac{7}{5}\end{array}[/latex-display]
try it
[ohm_question]147022[/ohm_question]Licenses & Attributions
CC licensed content, Original
- Question ID 147022, 147021, 147020. Authored by: Lumen Learning. License: CC BY: Attribution.
CC licensed content, Specific attribution
- Prealgebra. Provided by: OpenStax License: CC BY: Attribution. License terms: Download for free at http://cnx.org/contents/[email protected].
