Describe Sets as Intersections or Unions
Learning Outcomes
- Use interval notation to describe intersections and unions
- Use graphs to describe intersections and unions
Use Interval Notation to Describe Sets of Numbers as Intersections and Unions
When two inequalities are joined by the word and, the solution of the compound inequality occurs when both inequalities are true at the same time. It is the overlap, or intersection, of the solutions for each inequality. When the two inequalities are joined by the word or, the solution of the compound inequality occurs when either of the inequalities is true. The solution is the combination, or union, of the two individual solutions. In this section we will learn how to solve compound inequalities that are joined with the words AND and OR. First, it will help to see some examples of inequalities, intervals, and graphs of compound inequalities. This will help you describe the solutions to compound inequalities properly. Venn diagrams use the concept of intersections and unions to compare two or more things. For example, this Venn diagram shows the intersection of people who are breaking your heart and those who are shaking your confidence daily. Apparently Cecilia has both of these qualities; therefore, she is the intersection of the two.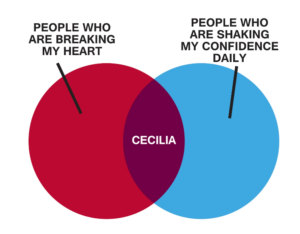 In mathematical terms, consider the inequality [latex]x\lt6[/latex] and [latex]x\gt2[/latex]. How would we interpret what numbers x can be, and what would the interval look like?
In words, x must be less than [latex]6[/latex], and at the same time, it must be greater than [latex]2[/latex]. This is much like the Venn diagram above where Cecilia is at once breaking your heart and shaking your confidence daily. Now look at a graph to see what numbers are possible with these constraints.
In mathematical terms, consider the inequality [latex]x\lt6[/latex] and [latex]x\gt2[/latex]. How would we interpret what numbers x can be, and what would the interval look like?
In words, x must be less than [latex]6[/latex], and at the same time, it must be greater than [latex]2[/latex]. This is much like the Venn diagram above where Cecilia is at once breaking your heart and shaking your confidence daily. Now look at a graph to see what numbers are possible with these constraints.
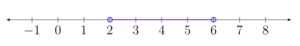
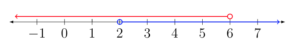 The numbers that are shared by both lines on the graph are called the intersection of the two inequalities [latex]x\lt6[/latex] and [latex]x\gt2[/latex]. This is called a bounded inequality and is written as [latex]2\lt{x}\lt6[/latex]. Think about that one for a minute. x must be less than [latex]6[/latex] and greater than two—the values for x will fall between two numbers. In interval notation, this looks like [latex]\left(2,6\right)[/latex]. The graph would look like this:
 On the other hand, if you need to represent two things that don't share any common elements or traits, you can use a union. The following Venn diagram shows two things that share no similar traits or elements but are often considered in the same application, such as online shopping or banking.
 In mathematical terms, for example, [latex]x>6[/latex] or [latex]x<2[/latex] is an inequality joined by the word or. Using interval notation, we can describe each of these inequalities separately:
[latex]x\gt6[/latex] is the same as [latex]\left(6, \infty\right)[/latex] and [latex]x<2[/latex] is the same as [latex]\left(-\infty, 2\right)[/latex]. If we are describing solutions to inequalities, what effect does the or have? We are saying that solutions are either real numbers less than two or real numbers greater than [latex]6[/latex]. Can you see why we need to write them as two separate intervals? Let us look at a graph to get a clear picture of what is going on.
In mathematical terms, for example, [latex]x>6[/latex] or [latex]x<2[/latex] is an inequality joined by the word or. Using interval notation, we can describe each of these inequalities separately:
[latex]x\gt6[/latex] is the same as [latex]\left(6, \infty\right)[/latex] and [latex]x<2[/latex] is the same as [latex]\left(-\infty, 2\right)[/latex]. If we are describing solutions to inequalities, what effect does the or have? We are saying that solutions are either real numbers less than two or real numbers greater than [latex]6[/latex]. Can you see why we need to write them as two separate intervals? Let us look at a graph to get a clear picture of what is going on.
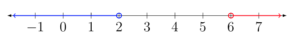 When you place both of these inequalities on a graph, we can see that they share no numbers in common. As mentioned above, this is what we call a union. The interval notation associated with a union is a big U, so instead of writing or, we join our intervals with a big U, like this:
[latex]\left(-\infty, 2\right)\cup\left(6, \infty\right)[/latex]
It is common convention to construct intervals starting with the value that is furthest left on the number line as the left value, such as [latex]\left(2,6\right)[/latex], where [latex]2[/latex] is less than [latex]6[/latex]. The number on the right should be greater than the number on the left.
Example
Draw the graph of the compound inequality [latex]x\gt3[/latex] or [latex]x\le4[/latex] and describe the set of x-values that will satisfy it with an interval.Answer:
The graph of [latex]x\gt3[/latex] has an open circle on [latex]3[/latex] and a blue arrow drawn to the right to contain all the numbers greater than [latex]3[/latex].
 The graph of [latex]x\le4[/latex] has a closed circle at 4 and a red arrow to the left to contain all the numbers less than [latex]4[/latex].
 What do you notice about the graph that combines these two inequalities?
 Since this compound inequality is an or statement, it includes all of the numbers in each of the solutions. In this case, the solution is all the numbers on the number line. (The region of the line greater than [latex]3[/latex] and less than or equal to [latex]4[/latex] is shown in purple because it lies on both of the original graphs.) The solution to the compound inequality [latex]x\gt3[/latex] or [latex]x\le4[/latex] is the set of all real numbers and can be described in interval notation as [latex]\left(-\infty, \infty\right)[/latex]
Examples
Draw a graph of the compound inequality: [latex]x\lt5[/latex] and [latex]x\ge−1[/latex], and describe the set of x-values that will satisfy it with an interval.Answer:
The graph of each individual inequality is shown in color.
 Since the word and joins the two inequalities, the solution is the overlap of the two solutions. This is where both of these statements are true at the same time.
The solution to this compound inequality is shown below.
Since the word and joins the two inequalities, the solution is the overlap of the two solutions. This is where both of these statements are true at the same time.
The solution to this compound inequality is shown below.
 Notice that this is a bounded inequality. You can rewrite [latex]x\ge−1\,\text{and }x\le5[/latex] as [latex]−1\le x\le 5[/latex] since the solution is between [latex]−1[/latex] and [latex]5[/latex], including [latex]−1[/latex]. You read [latex]−1\le x\lt{5}[/latex] as “x is greater than or equal to [latex]−1[/latex] and less than [latex]5[/latex].” You can rewrite an and statement this way only if the answer is between two numbers. The set of solutions to this inequality can be written in interval notation like this: [latex]\left[{-1},{5}\right)[/latex]
Examples
Draw the graph of the compound inequality [latex]x\lt{-3}[/latex] and [latex]x\gt{3}[/latex], and describe the set of x-values that will satisfy it with an interval.Answer:
First, draw a graph. We are looking for values for x that will satisfy both inequalities since they are joined with the word and.
 In this case, there are no shared x-values, and therefore there is no intersection for these two inequalities. We can write "no solution," or DNE.
Licenses & Attributions
CC licensed content, Original
- Cecilia Venn Diagram Image. Authored by: Lumen Learning. License: CC BY: Attribution.
- Internet Privacy Venn Diagram. Authored by: Lumen Learning. License: CC BY: Attribution.
- Revision and Adaptation. Provided by: Lumen Learning License: CC BY: Attribution.
- Solutions to Basic OR Compound Inequalities. Authored by: James Sousa (Mathispower4u.com) for Lumen Learning. License: CC BY: Attribution.
- Solutions to Basic AND Compound Inequalities Mathispower4u . Authored by: James Sousa (Mathispower4u.com) for Lumen Learning. License: CC BY: Attribution.
CC licensed content, Shared previously
- College Algebra. Provided by: Lumen Learning Authored by: Jay Abramson, et. al. License: CC BY: Attribution.
- Unit 10: Solving Equations and Inequalities, from Developmental Math: An Open Program. Provided by: Monterey Institute of Technology and Education Located at: https://www.nroc.org/. License: CC BY: Attribution.
