The Polar Coordinate System
Introduction to the Polar Coordinate System
The polar coordinate system is an alternate coordinate system where the two variables are [latex]r[/latex] and [latex]\theta[/latex], instead of [latex]x[/latex] and [latex]y[/latex].
Learning Objectives
Discuss the characteristics of the polar coordinate system
Key Takeaways
Key Points
- A polar coordinate system is a two-dimensional coordinate system in which each point on a plane is determined by a distance from a reference point and an angle from a reference direction.
Key Terms
- radius: A distance measured from the pole.
- angular coordinate: An angle measured from the polar axis, usually counter-clockwise.
- pole: The reference point of the polar graph.
- polar axis: A ray from the pole in the reference direction.
Introduction of Polar Coordinates
In mathematics, the polar coordinate system is a two-dimensional coordinate system in which each point on a plane is determined by a distance from a reference point and an angle from a reference direction.
When we think about plotting points in the plane, we usually think of rectangular coordinates [latex](x,y)[/latex] in the Cartesian coordinate plane. However, there are other ways of writing a coordinate pair and other types of grid systems. Polar coordinates are points labeled [latex](r,θ)[/latex] and plotted on a polar grid. The polar grid is represented as a series of concentric circles radiating out from the pole, or the origin of the coordinate plane.
The reference point (analogous to the origin of a Cartesian system) is called the pole, and the ray from the pole in the reference direction is the polar axis. The distance from the pole is called the radial coordinate or radius, and the angle is called the angular coordinate, polar angle, or azimuth. The radial coordinate is often denoted by [latex]r[/latex] or [latex]ρ[/latex], and the angular coordinate by [latex]ϕ[/latex], [latex]θ[/latex], or [latex]t[/latex].
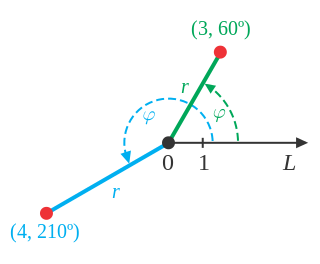 Examples of Polar Coordinates:
 Points in the polar coordinate system with pole [latex]0[/latex] and polar axis [latex]L[/latex]. In green, the point with radial coordinate [latex]3[/latex] and angular coordinate [latex]60[/latex] degrees or [latex](3,60^{\circ})[/latex]. In blue, the point [latex](4,210^{\circ})[/latex].
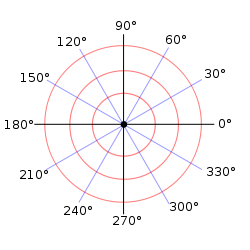 Polar Graph Paper:
 A polar grid with several angles labeled in degrees
Plotting Points Using Polar Coordinates
The polar grid is scaled as the unit circle with the positive [latex]x[/latex]-axis now viewed as the polar axis and the origin as the pole. The first coordinate [latex]r[/latex] is the radius or length of the directed line segment from the pole. The angle [latex]θ[/latex], measured in radians, indicates the direction of [latex]r[/latex]. We move counterclockwise from the polar axis by an angle of [latex]θ[/latex],and measure a directed line segment the length of [latex]r[/latex] in the direction of [latex]θ[/latex]. Even though we measure [latex]θ[/latex] first and then [latex]r[/latex], the polar point is written with the [latex]r[/latex]-coordinate first. For example, to plot the point [latex](2,\frac{\pi }{4})[/latex],we would move [latex]\frac{\pi }{4}[/latex] units in the counterclockwise direction and then a length of [latex]2[/latex] from the pole. This point is plotted on the grid in Figure.
 Plotting a point on a Polar Grid:
 Plot of the point [latex](2,\frac{\pi }{4})[/latex],by moving [latex]\frac{\pi }{4}[/latex] units in the counterclockwise direction and then a length of [latex]2[/latex] from the pole.
Uniqueness of polar coordinates
Adding any number of full turns ([latex]360^{\circ} [/latex] or [latex]2\pi[/latex] radians) to the angular coordinate does not change the corresponding direction. Also, a negative radial coordinate is best interpreted as the corresponding positive distance measured in the opposite direction. Therefore, the same point can be expressed with an infinite number of different polar coordinates([latex]r, \phi \pm n\cdot 360°[/latex]) or ([latex]−r, \phi \pm (2n + 1)\cdot 180°[/latex]), where [latex]n[/latex] is any integer. Moreover, the pole itself can be expressed as ([latex]0, ϕ[/latex]) for any angle [latex]ϕ[/latex].
Converting Between Polar and Cartesian Coordinates
Polar and Cartesian coordinates can be interconverted using the Pythagorean Theorem and trigonometry.
Learning Objectives
Derive and use the formulae for converting between Polar and Cartesian coordinates
Key Takeaways
Key Points
- To convert from polar to rectangular (Cartesian) coordinates use the following formulas (derived from their trigonometric function definitions):
- [latex]\cos \theta =\frac{x}{r}\rightarrow x=r\cos \theta\\\sin \theta =\frac{y}{r}\rightarrow y=r\sin \theta \\r^2=x^2+y^2\\\tan\theta=\frac{y}{x}[/latex]
Polar Coordinates to Rectangular (Cartesian) Coordinates
When given a set of polar coordinates, we may need to convert them to rectangular coordinates. To do so, we can recall the relationships that exist among the variables [latex]x[/latex], [latex]y[/latex], [latex]r[/latex], and [latex]θ[/latex], from the definitions of [latex]\cos \theta[/latex] and [latex]\sin \theta[/latex]. Solving for the variables [latex]x[/latex] and [latex]y[/latex] yields the following formulas:
[latex]\displaystyle
\cos \theta =\frac{x}{r}\quad\Rightarrow\quad x=r\cos \theta [/latex]
[latex]\displaystyle
\sin \theta =\frac{y}{r}\quad\Rightarrow\quad y=r\sin \theta [/latex]
An easy way to remember the equations above is to think of [latex]\cos\theta[/latex] as the adjacent side over the hypotenuse and [latex]\sin\theta[/latex] as the opposite side over the hypotenuse. Dropping a perpendicular from the point in the plane to the [latex]x[/latex]-axis forms a right triangle, as illustrated in Figure below.
 Trigonometry Right Triangle:
 A right triangle with rectangular (Cartesian) coordinates and equivalent polar coordinates.
Example: Write the polar coordinates [latex](3,\frac {\pi}{2})[/latex] as rectangular coordinates.
[latex]\displaystyle
\begin{align}
x &= r\cos \theta \\
&= 3cos \frac{\pi}{2}\\
&= 0
\end{align}
[/latex]
[latex]\displaystyle
\begin{align}
y&=r\sin \theta\\&=3\sin\frac{\pi}{2}\\&=3
\end{align}[/latex]
The rectangular coordinates are [latex](0,3)[/latex].
 Polar and Coordinate Grid of Equivalent Points:
 The rectangular coordinate [latex](0,3)[/latex] is the same as the polar coordinate [latex](3,\frac {\pi}{2})[/latex] as plotted on the two grids above.
Rectangular (Cartesian) Coordinates to Polar Coordinates
To convert rectangular coordinates to polar coordinates, we will use two other familiar relationships. With this conversion, however, we need to be aware that a set of rectangular coordinates will yield more than one polar point.
Converting from rectangular coordinates to polar coordinates requires the use of one or more of the relationships illustrated below. Recall:
[latex]\displaystyle
\begin{align}
\cos \theta &=\frac{x}{r}\quad\Rightarrow\quad x=r\cos \theta
\\\sin \theta &=\frac{y}{r}\quad\Rightarrow\quad y=r\sin \theta \\
r^2&=x^2+y^2\\\tan\theta&=\frac{y}{x}
\end{align}[/latex]
 Trigonometry Right Triangle:
 A right triangle with rectangular (Cartesian) coordinates and equivalent polar coordinates.
Example:
Convert the rectangular coordinates [latex](3,3)[/latex] to polar coordinates.
We are given the values of [latex]x[/latex] and [latex]y[/latex] and need to solve for [latex]\theta[/latex] and [latex]r[/latex]. Start by solving for [latex]\theta[/latex] using the [latex]\tan[/latex] function:
[latex]\displaystyle
\begin{align}
\tan \theta&=\frac{y}{x}\\&=\frac{3}{3}\\&=1\\
\end{align}[/latex]
So:
[latex]\displaystyle
\begin{align}
\theta &= \tan^{-1}\left( 1 \right)\\
&=\frac{\pi}{4}
\end{align}
[/latex]
Next substitute the values of [latex]x[/latex]
and [latex]y[/latex] into the formula [latex]r^2=x^2+y^2[/latex] and solve for [latex]r[/latex].
[latex]\displaystyle
\begin{align}
r^2&=x^2+y^2\\
&=3^2+3^2\\
&=18\\
\end{align}[/latex]
So:
[latex]\displaystyle
\begin{align}
r&=\sqrt{18}\\
&=3\sqrt{2}
\end{align}
[/latex]
The polar coordinates are [latex](3\sqrt2,\frac{\pi}{4})[/latex].
Note that [latex]r^2 = 18[/latex] implies [latex]r=\pm\sqrt{18}[/latex]. We chose to ignore the negative [latex]r[/latex] value. Also note that [latex]\tan^{-1}\left( 1 \right)[/latex] has many answers. This corresponds to the non-uniqueness of polar coordinates. Multiple sets of polar coordinates can have the same location as our first solution. For example, the points
[latex-display](-3\sqrt2,\frac{5\pi}{4})[/latex-display]
and [latex](3\sqrt2,-\frac{7\pi}{2})[/latex] will coincide with the original solution of [latex](3\sqrt2,\frac{\pi}{4})[/latex].
Conics in Polar Coordinates
Polar coordinates allow conic sections to be expressed in an elegant way.
Learning Objectives
Describe the equations for different conic sections in polar coordinates
Key Takeaways
Key Points
- Conic sections have several key features which define their polar equation; foci, eccentricity, and a directrix.
- All conic sections have the same basic equation in polar coordinates, which demonstrates a connection between all of them.
Key Terms
- eccentricity: A measure of deviation from a prescribed curve.
- directrix: A fixed line used to described a curve.
Defining a Conic
Previously, we learned how a parabola is defined by the focus (a fixed point ) and the directrix (a fixed line).
 Parts of a Parabola:
 Consider the parabola [latex]x=2+y^2[/latex]. Any conic may be determined by three characteristics: a single focus, a fixed line called the directrix, and the ratio of the distances of each to a point on the graph.
- If [latex]0≤e<1[/latex], the conic is an ellipse.
- If [latex]e=1[/latex], the conic is a parabola.
- If [latex]e>1[/latex], the conic is an hyperbola .
With this definition, we may now define a conic in terms of the directrix: [latex]x=±p[/latex], the eccentricity [latex]e[/latex], and the angle [latex]\theta[/latex]. Thus, each conic may be written as a polar equation in terms of [latex]r[/latex] and [latex]\theta[/latex].
For a conic with a focus at the origin, if the directrix is [latex]x=±p[/latex], where [latex]p[/latex] is a positive real number, and the eccentricity is a positive real number [latex]e[/latex], the conic has a polar equation:
[latex]\displaystyle
r=\frac{e\cdot p}{1\: \pm\: e\cdot\cos\theta}[/latex]
For a conic with a focus at the origin, if the directrix is [latex]y=±p[/latex], where [latex]p[/latex] is a positive real number, and the eccentricity is a positive real number [latex]e[/latex], the conic has a polar equation:
[latex]\displaystyle
r=\frac{e\cdot p}{1\: \pm\: e\cdot\sin\theta}[/latex]
Other Curves in Polar Coordinates
Some curves have a simple expression in polar coordinates, whereas they would be very complex to represent in Cartesian coordinates.
Learning Objectives
Describe the equations for spirals and roses in polar coordinates
Key Takeaways
Key Points
- The formulas that generate the graph of a rose curve are given by: [latex]r=a\:\cos n\theta[/latex] and [latex]r=a\:\sin n\theta[/latex] where [latex]a \ne 0[/latex]. If [latex]n[/latex] is even, the curve has [latex]2n[/latex] petals. If [latex]n[/latex] is odd, the curve has [latex]n[/latex] petals.
- The formula that generates the graph of the Archimedes’ spiral is given by: [latex]r=θ[/latex] for [latex]θ≥0[/latex]. As [latex]\theta[/latex] increases, [latex]r[/latex] increases at a constant rate in an ever-widening, never-ending, spiraling path.
Key Terms
- Archimedes’ spiral: A curve given by an equation of the form [latex]r=a + b\theta[/latex]
- rose curve: A curve given by an equation of the form [latex]r = a\cos n\theta[/latex] or [latex]r=a\sin n\theta[/latex]
To graph in the rectangular coordinate system we construct a table of [latex]x[/latex] and [latex]y[/latex] values. To graph in the polar coordinate system we construct a table of [latex]r[/latex] and [latex]\theta[/latex] values. We enter values of [latex]\theta[/latex] into a polar equation and calculate [latex]r[/latex]. However, using the properties of symmetry and finding key values of [latex]\theta[/latex] and [latex]r[/latex] means fewer calculations will be needed.
Investigating Rose Curves
Polar equations can be used to generate unique graphs. The following type of polar equation produces a petal-like shape called a rose curve. Although the graphs look complex, a simple polar equation generates the pattern. The formulas that generate the graph of a rose curve are given by:
[latex]\displaystyle
r=a\cdot\cos \left( n\theta \right) \qquad \text{and}
\qquad r=a\cdot\sin \left( n\theta \right) \qquad \text{where}
\qquad a\ne 0[/latex]
If [latex]n[/latex] is even, the curve has [latex]2n[/latex] petals. If [latex]n[/latex] is odd, the curve has [latex]n[/latex] petals.
 Rose Curves:
 Complex graphs generated by the simple polar formulas that generate rose curves:[latex]r=a\:\cos n\theta[/latex] and [latex]r=a\:\sin n\theta[/latex] where [latex]a≠0[/latex].
Investigating the Archimedes' Spiral
Archimedes’ spiral is named for its discoverer, the Greek mathematician Archimedes ([latex]c. 287 BCE - c. 212 BCE[/latex]), who is credited with numerous discoveries in the fields of geometry and mechanics.
The formula that generates the graph of the Archimedes’ spiral is given by:
[latex-display]\displaystyle r=a + b\theta \qquad \text{for} \qquad \theta\geq 0[/latex-display]
As [latex]\theta[/latex] increases, [latex]r[/latex] increases at a constant rate in an ever-widening, never-ending, spiraling path.
 Archimedes' Spiral:
 The formula that generates the graph of a spiral is [latex]r=θ[/latex] for [latex]θ≥0[/latex].
Licenses & Attributions
CC licensed content, Shared previously
CC licensed content, Specific attribution
