Introduction to Functions
Functions and Their Notation
A function maps a set of inputs onto a set of permissible outputs. Each input corresponds with one and only one outputLearning Objectives
Connect the notation of functions to the notation of equations and understand the criteria for a valid functionKey Takeaways
Key Points
- Functions are a relation between a set of inputs and a set of outputs with the property that each input maps to exactly one output.
- Typically functions are named with a single letter such as f.
- Functions can be thought of as a machine in a box that is open on two ends. You put something into one end of the box, it somehow gets changed inside of the box, and then the result pops out the other end.
- All functions are relations, but not all relations are functions.
Key Terms
- output: The output is the result or answer from a function.
- relation: A relation is a connection between numbers in one set and numbers in another.
- function: A function is a relation in which each element of the input is associated with exactly one element of the output.
Functions
In mathematics, a function is a relation between a set of inputs and a set of permissible outputs. Functions have the property that each input is related to exactly one output. For example, in the function [latex]f(x)=x^2[/latex] any input for [latex]x[/latex] will give one output only. Functions are typically named with a single letter, like [latex]f[/latex]. [latex]f(x)[/latex] is read " [latex]f[/latex] of [latex]x[/latex]", and represents the output of the function [latex]f[/latex] corresponding to an input [latex]x[/latex]. The input variable (s) are sometimes referred to as the argument(s) of the function. Consider the following example: Let [latex]f(x)=x^2[/latex] Let [latex]x=-3[/latex], then: [latex]\displaystyle f(-3)=(-3)^2 [/latex] [latex]\displaystyle =9[/latex] In the example above, the argument is [latex]x=-3[/latex] and the output is [latex]9[/latex]. We write the function as:[latex]f(-3)=9[/latex]. In the case of a function with just one input variable, the input and output of the function can be expressed as an ordered pair. The order is such that the first element is the argument and the second is the output. In the example above, [latex]f(x)=x^2[/latex], we have the ordered pair [latex](−3, 9)[/latex]. If both the input and output are real numbers then the ordered pair can be viewed as the Cartesian coordinates of a point on the graph of the function. Another commonly used notation for a function is [latex]f:X\rightarrow Y[/latex], which reads as saying that [latex]f[/latex] is a function that maps values from the set [latex]X[/latex] onto values of the set [latex]Y[/latex].Functions as a Machine
Functions are often described as a machine in a box that is open on two ends. You put something into one end of the box, it gets changed inside of the box, and then the result pops out the other end. The function is the machine inside the box and it's defined by what it does to whatever you put into it. Function Machine: A function [latex]f[/latex] takes an input [latex]x[/latex] and returns an output [latex]f(x)[/latex]. One metaphor describes the function as a "machine", that for each input returns a corresponding output.
Let's say the machine has a blade that slices whatever you put in into two and sends one half of that object out the other end. If you put in a banana you would get back half a banana. If you put in an apple you would get back half an apple.
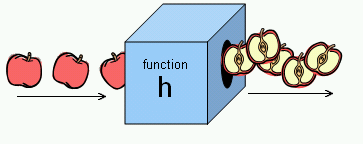 Fruit Halving Function: This shows a function that takes a fruit as input and releases half the fruit as output.
Let's define the function to take what you put into it and cut it in half. That is, the function divides the input by two. If you put in [latex]2[/latex] you would get back [latex]1[/latex]. If you put in [latex]57[/latex] you would get back [latex]28.5[/latex]. The function machine allows us to alter expressions. In this example, the function would be written as:
[latex]\displaystyle f(x)=\frac{1}{2}x[/latex].Functions As a Relation
Functions can also be thought of as a subset of relations. A relation is a connection between values in one set and values in another. In other words, each number you put in is associated with each number you get out. In a function every input number is associated with exactly one output number In a relation an input number may be associated with multiple or no output numbers. This is an important fact about functions that cannot be stressed enough: every possible input to the function must have one and only one output. All functions are relations, but not all relations are functions.Graphical Representations of Functions
Graphs provide a visual representation of functions, showing the relationship between the input values and output values.Learning Objectives
Describe the relationship between graphs of equations and graphs of functionsKey Takeaways
Key Points
- Functions have an independent variable and a dependent variable. Typically [latex]x[/latex] is the independent variable and [latex]y[/latex] the dependent variable.
- As you choose any valid value for the independent variable, the dependent variable is determined by the function.
- To graph a function, choose some values for the independent variable, [latex]x[/latex], plug them into the function to get a set of ordered pairs [latex](x,f(x))[/latex], and plot these on the graph. Then connect the points to best match how the points are arranged on the graph. Make sure you have enough points.
Key Terms
- dependent variable: The dependant variable in an equation or function is that whose value depends on one or more independant variables in the equation or function.
- independent variable: An independent variable in an equation or function is one whose value is not dependent on any other in the equation or function.
- graph: A diagram displaying data; in particular one showing the relationship between two or more quantities, measurements, or numbers.
Independent and Dependent Variables in Function Notation
Functions have an independent variable and a dependent variable. When we look at a function such as [latex]f(x)=\frac{1}{2}x[/latex], we call the variable that we are changing, in this case [latex]x[/latex], the independent variable. We assign the value of the function to a variable, in this case [latex]y[/latex], that we call the dependent variable. Function notation, [latex]f(x)[/latex] is read as "[latex]f[/latex] of [latex]x[/latex]" which means "the value of the function at [latex]x[/latex]." Since the output, or dependent variable is [latex]y[/latex], for function notation often times [latex]f(x)[/latex] is thought of as [latex]y[/latex]. The ordered pairs normally stated in linear equations as [latex](x,y)[/latex], in function notation are now written as [latex](x,f(x))[/latex]. We say that [latex]x[/latex] is independent because we can pick any value for which the function is defined, in this case the set of real numbers [latex]\mathbb{R}[/latex], as inputs into the function. We say the result is assigned to the dependent variable since it depends on what value we placed into the function.Graphing Functions
Example 1: Let's start with a simple linear function: [latex]\displaystyle f(x)=5-\frac{5}{2}x[/latex]. Start by graphing as if [latex]f(x)[/latex] is a linear equation: [latex]\displaystyle y=5-\frac{5}{2}x[/latex] We choose a few values for the independent variable, [latex]x[/latex]. Let's choose a negative value, zero, and a positive value: [latex]\displaystyle x=-2, 0, 2 [/latex]. Next, substitute these values into the function for [latex]x[/latex], and solve for [latex]f(x)[/latex] (which means the same as the dependent variable [latex]y[/latex]): we get the ordered pairs: [latex]\displaystyle (-2,10), (0,5), (2,0)[/latex] This function is that of a line, since the highest exponent in the function is a [latex]1[/latex], so simply connect the three points. Extend them in either direction past the points to infinity, and we have our graph.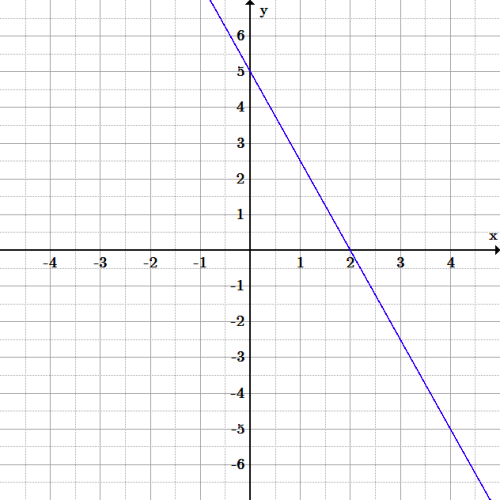 Line graph: This is the graph of the function [latex]f(x)=5-\frac{5}{2}x[/latex]. The function is linear, since the highest degree in the function is a [latex]1[/latex]. Only two points are required to graph a linear function.
Example 2: Graph the function:
[latex]\displaystyle f(x)=x^{3}-9x[/latex]. Start by choosing values for the independent variable, [latex]x[/latex]. This function is more complicated than that of a line so we'll need to choose more points. Let us choose: [latex]\displaystyle x=\{0, \pm1, \pm2, \pm3, \pm4\}[/latex]. Next, plug these values into the function, [latex]f(x)=x^{3}-9x[/latex], to get a set of ordered pairs, in this case we get the set of ordered pairs: [latex]\displaystyle \{(-4, -28),(-3,0)(-2,10),(-1,8),(0,0),(1,-8),(2,-10),(3,0),(4,28)\}[/latex]. Next place these points on the graph, and connect them as best as possible with a curve. The graph for this function is below.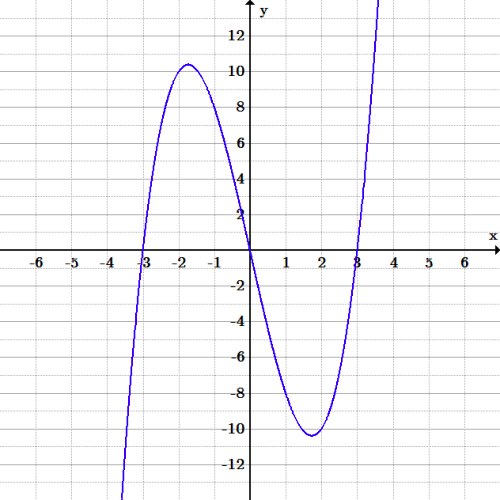 Cubic graph: Graph of the cubic function [latex]f(x)=x^{3}-9x[/latex]. The degree of the function is 3, therefore it is a cubic function.
The Vertical Line Test
The vertical line test is used to determine whether a curve on an [latex]xy[/latex]-plane is a functionLearning Objectives
Explain why the vertical line test shows, graphically, whether or not a curve is a functionKey Takeaways
Key Points
- A function can only have one output, [latex]y[/latex], for each unique input, [latex]x[/latex]. If any [latex]x[/latex]-value in a curve is associated with more than one [latex]y[/latex]-value, then the curve does not represent a function.
- If a vertical line intersects a curve on an [latex]xy[/latex]-plane more than once, then for one value of x the curve has more than one value of y, and the curve does not represent a function.
Key Terms
- function: A relation in which each element of the input is associated with exactly one element of the output.
- vertical line test: A visual test that determines whether a curve is a function or not by examining the number of [latex]y[/latex]-values associated with each [latex]x[/latex]-value that lies on the curve.
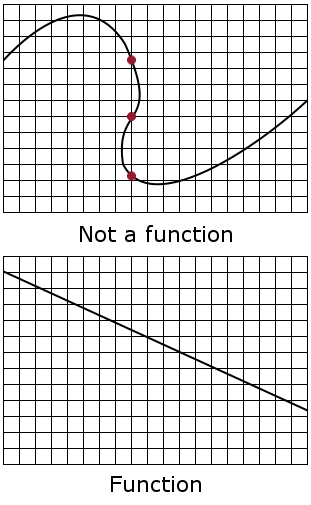 Vertical Line Test: Note that in the top graph, a single vertical line drawn where the red dots are plotted would intersect the curve 3 times. Thus, it fails the vertical line test and does not represent a function. Any vertical line in the bottom graph passes through only once and hence passes the vertical line test, and thus represents a function.
To use the vertical line test, take a ruler or other straight edge and draw a line parallel to the [latex]y[/latex]-axis for any chosen value of [latex]x[/latex]. If the vertical line you drew intersects the graph more than once for any value of [latex]x[/latex] then the graph is not the graph of a function. If, alternatively, a vertical line intersects the graph no more than once, no matter where the vertical line is placed, then the graph is the graph of a function. For example, a curve which is any straight line other than a vertical line will be the graph of a function.
Example
Refer to the three graphs below, [latex](a)[/latex], [latex](b)[/latex], and [latex](c)[/latex]. Apply the vertical line test to determine which graphs represent functions. Applying the Vertical Line Test: Which graphs represent functions?
If any vertical line intersects a graph more than once, the relation represented by the graph is not a function. Notice that any vertical line would pass through only one point of the two graphs shown in graphs [latex](a)[/latex] and [latex](b)[/latex]. From this we can conclude that these two graphs represent functions. The third graph, [latex](c)[/latex], does not represent a function because, at most [latex]x[/latex]-values, a vertical line would intersect the graph at more than one point. This is shown in the diagram below.
 Not a Function: The vertical line test demonstrates that a circle is not a function.
Licenses & Attributions
CC licensed content, Shared previously
- Curation and Revision. Authored by: Boundless.com. License: Public Domain: No Known Copyright.
CC licensed content, Specific attribution
- Function (mathematics). Provided by: Wikipedia Located at: https://en.wikipedia.org/wiki/Function_(mathematics). License: CC BY-SA: Attribution-ShareAlike.
- Algebra/Functions. Provided by: Wikibooks License: CC BY-SA: Attribution-ShareAlike.
- function. Provided by: Wiktionary License: CC BY-SA: Attribution-ShareAlike.
- Boundless. Provided by: Boundless Learning License: CC BY-SA: Attribution-ShareAlike.
- output. Provided by: Wiktionary License: CC BY-SA: Attribution-ShareAlike.
- Function machine2. Provided by: Wikipedia License: Public Domain: No Known Copyright.
- Apple slicing function. Provided by: Wikibooks License: CC BY-SA: Attribution-ShareAlike.
- independent variable. Provided by: Wiktionary License: CC BY-SA: Attribution-ShareAlike.
- Algebra/Function Graphing. Provided by: Wikibooks License: CC BY-SA: Attribution-ShareAlike.
- Graph of a function. Provided by: Wikipedia License: CC BY-SA: Attribution-ShareAlike.
- graph. Provided by: Wiktionary License: CC BY-SA: Attribution-ShareAlike.
- dependent variable. Provided by: Wiktionary License: CC BY-SA: Attribution-ShareAlike.
- Function machine2. Provided by: Wikipedia License: Public Domain: No Known Copyright.
- Apple slicing function. Provided by: Wikibooks License: CC BY-SA: Attribution-ShareAlike.
- Original figure by Julien Coyne. Licensed CC BY-SA 4.0. Provided by: Julien Coyne License: CC BY-SA: Attribution-ShareAlike.
- Original figure by Julien Coyne. Licensed CC BY-SA 4.0. Provided by: Julien Coyne License: CC BY-SA: Attribution-ShareAlike.
- Functions and Function Notation. Provided by: OpenStax Located at: https://cnx.org/contents/11f4eacc-c348-4836-8c5b-747577d249ca@6. License: CC BY: Attribution.
- Functions and Their Notation. Provided by: Boundless License: CC BY-SA: Attribution-ShareAlike.
- Vertical line test. Provided by: Wikipedia Located at: https://en.wikipedia.org/wiki/Vertical_line_test. License: CC BY-SA: Attribution-ShareAlike.
- Function machine2. Provided by: Wikipedia License: Public Domain: No Known Copyright.
- Apple slicing function. Provided by: Wikibooks License: CC BY-SA: Attribution-ShareAlike.
- Original figure by Julien Coyne. Licensed CC BY-SA 4.0. Provided by: Julien Coyne License: CC BY-SA: Attribution-ShareAlike.
- Original figure by Julien Coyne. Licensed CC BY-SA 4.0. Provided by: Julien Coyne License: CC BY-SA: Attribution-ShareAlike.
- Functions and Function Notation. Provided by: OpenStax Located at: https://cnx.org/contents/11f4eacc-c348-4836-8c5b-747577d249ca@6. License: CC BY: Attribution.
- Functions and Function Notation. Provided by: OpenStax License: CC BY: Attribution.
- Vertical line test. Provided by: Wikipedia License: Public Domain: No Known Copyright.
