E1.10: Section 6 Part 2
Start exploring. How does changing h change the graph? Start by changing h to -2. That makes the spreadsheet look like the illustration below.| A | B | C | D | E | F | G | H | |
| 1 | x | y | ||||||
| 2 | -6 | 36 | 2 | a | ||||
| 3 | -5 | 22 | -2 | h | ||||
| 4 | -4 | 12 | 4 | k | ||||
| 5 | -3 | 6 | ||||||
| 6 | -2 | 4 | ||||||
| 7 | -1 | 6 | ||||||
| 8 | 0 | 12 | ||||||
| 9 | 1 | 22 | ||||||
| 10 | 2 | 36 | ||||||
| 11 | 3 | 54 | ||||||
| 12 | 4 | 76 | ||||||
| 13 | 5 | 102 | ||||||
| 14 | 6 | 132 | ||||||
| 15 | ||||||||
| 16 |
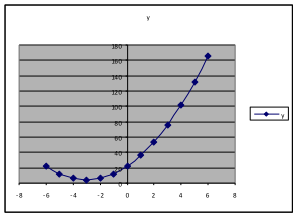
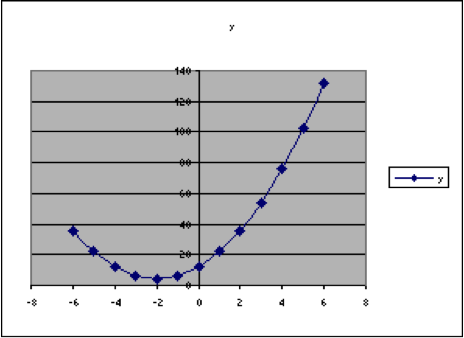 Now we can notice that, when [latex]h=3[/latex], the lowest point on the graph is at [latex]x=3[/latex], and when [latex]h=-2[/latex], then the lowest point on the graph is at [latex]x=-2[/latex].
This suggests that maybe the value that is subtracted from x in the original formula is the one that determines where the lowest y-value is – that is, where the lowest point on the graph is.
Try [latex]h=0[/latex], [latex]h=4[/latex], and [latex]h=-3[/latex].
Now we can notice that, when [latex]h=3[/latex], the lowest point on the graph is at [latex]x=3[/latex], and when [latex]h=-2[/latex], then the lowest point on the graph is at [latex]x=-2[/latex].
This suggests that maybe the value that is subtracted from x in the original formula is the one that determines where the lowest y-value is – that is, where the lowest point on the graph is.
Try [latex]h=0[/latex], [latex]h=4[/latex], and [latex]h=-3[/latex].
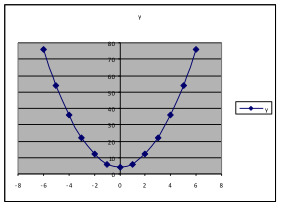
| [latex-display]h=0[/latex-display] (leaving [latex]a=2[/latex] and [latex]k=4[/latex]) | [latex-display]h=4[/latex-display] (leaving [latex]a=2[/latex] and [latex]k=4[/latex]) | [latex-display]h=-3[/latex-display] (leaving [latex]a=2[/latex] and [latex]k=4[/latex]) |
 |
 |
 |
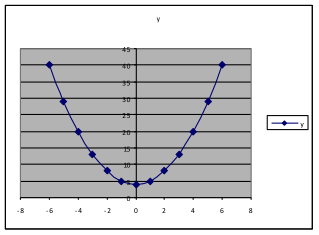
| [latex-display]k=4[/latex-display] (leaving [latex]a=1[/latex] and [latex]h=0[/latex]) | [latex-display]k=0[/latex-display] (leaving [latex]a=1[/latex] and [latex]h=0[/latex]) | [latex-display]k=-7[/latex-display] (leaving [latex]a=1[/latex] and [latex]h=0[/latex]) |
 |
 |
 |
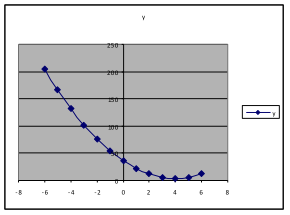
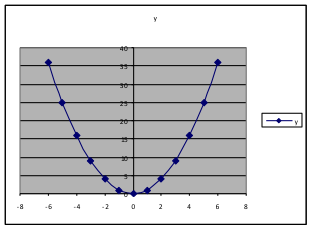
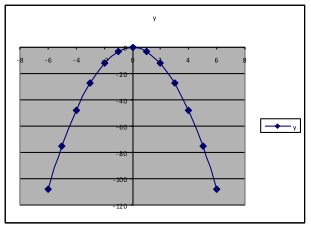
| [latex-display]a=1[/latex-display] (with [latex]h=0[/latex] and [latex]k=0[/latex]) | [latex-display]a=3[/latex-display] (with[latex]h=0[/latex] and [latex]k=0[/latex]) | [latex-display]a=-3[/latex-display] (with [latex]h=0[/latex] and [latex]k=0[/latex]) |
 |
 |
 |
Licenses & Attributions
CC licensed content, Shared previously
- Mathematics for Modeling. Authored by: Mary Parker and Hunter Ellinger. License: CC BY: Attribution.
